<?xml version="1.0" encoding="utf-8"?>
<feed xmlns="http://www.w3.org/2005/Atom">
    <title>FlowFuse</title>
    <link href="https://flowfuse.com/blog/index.xml" rel="self"/>
    <link href="https://flowfuse.com/blog"/>
    <updated>2026-09-25T00:00:00.000Z</updated>
    <id>https://flowfuse.com/blog</id>
    <entry>
        <id>https://flowfuse.com/blog/2026/09/5-whys-vs-fishbone-diagram/</id>
        <title>5 Whys vs. Fishbone Diagram: Which Is Right for You?</title>
        <summary>Use 5 Whys when the evidence points to one clear causal chain, a Fishbone Diagram when there are several possible causes, and both when you need to narrow down many causes and then dig into one.</summary>
        <content type="html"><![CDATA[<p>A production problem can be easy to spot but much harder to explain. A machine stops, a defect appears, or a process starts producing inconsistent results. Fixing the immediate issue may get things back on track, but it does not always tell you why the problem happened in the first place.</p><p>That is where root cause analysis comes in.</p><p>5 Whys and the Fishbone Diagram are two common ways to investigate production problems. One helps you follow a cause deeper, while the other helps you organize possible causes when the situation is less clear.</p><p>Either way, the investigation needs evidence. Production data, machine readings, quality records, and process information can help you determine which causes are worth investigating.</p><a href="https://flowfuse.com/book-demo/"><img src="https://flowfuse.com/blog/2026/09/images/5-whys-vs-fishbone.png" alt="Root cause analysis runs on evidence. FlowFuse connects your machines, PLCs, and quality systems so you can check every suspected cause against real production data. Book a demo."/></a><p>So, how do you decide which technique to use?</p><h2 id="_5-whys-vs-fishbone-diagram">5 Whys vs. Fishbone Diagram</h2><p>The two methods differ mainly in how they structure an investigation.</p><table><thead><tr><th></th><th>5 Whys</th><th>Fishbone Diagram</th></tr></thead><tbody><tr><td>Best for</td><td>A problem with a clear or likely cause</td><td>A problem with several possible causes</td></tr><tr><td>Approach</td><td>Follows a chain of causes</td><td>Maps possible causes across categories</td></tr><tr><td>Main question</td><td>"Why did this happen?"</td><td>"What could be causing this?"</td></tr><tr><td>Investigation</td><td>Goes deeper into one line of reasoning</td><td>Explores different areas that may contribute</td></tr><tr><td>Team size</td><td>Works well with a small team</td><td>Often useful with a cross-functional team</td></tr><tr><td>Typical output</td><td>A chain leading toward an underlying cause</td><td>A structured map of possible causes</td></tr><tr><td>Can be combined?</td><td>Yes</td><td>Yes</td></tr></tbody></table><p>The table gives you the basic distinction. The sections below show how each method works in practice.</p><h2 id="when-should-you-use-5-whys">When Should You Use 5 Whys?</h2><p>5 Whys works well when you can investigate a problem by repeatedly asking why one event led to another.</p><p>For example, suppose a production machine stops unexpectedly. The team finds that the motor overheated and starts asking why:</p><ol><li><strong>Why did the motor stop?</strong> Because it overheated.</li><li><strong>Why did it overheat?</strong> Because the cooling fan was not running.</li><li><strong>Why was the fan not running?</strong> Because its power supply had failed.</li></ol><p>The team can continue until it reaches a cause that explains the failure and can be addressed.</p><p>Despite the name, you do not have to ask exactly five questions. Five is a guideline, not a fixed rule. Some problems may take three questions, while others may require more.</p><p>The technique is most useful when each answer gives you a reasonable basis for the next question. If the investigation starts branching into several unrelated possibilities, another approach may be more useful.</p><p>For a deeper explanation, see our guide to <a href="https://flowfuse.com/blog/2025/12/five-whys-root-cause-analysis-definition-examples/">5 Whys root cause analysis</a>.</p><h2 id="when-should-you-use-a-fishbone-diagram">When Should You Use a Fishbone Diagram?</h2><p>A Fishbone Diagram helps a team organize the different factors that could be contributing to a problem.</p><p>For example, imagine that surface defects on a production line have suddenly increased. The team might investigate:</p><ul><li>Machine settings</li><li>Incoming material</li><li>Work methods</li><li>Operator training</li><li>Measurement systems</li><li>Environmental conditions</li></ul><p>In manufacturing, these possibilities are often organized using the 6M categories: Manpower, Machine, Method, Material, Measurement, and Mother Nature.</p><p>The diagram gives the team a structured way to capture ideas without immediately settling on one explanation.</p><p>However, a possible cause on the diagram is only a hypothesis. The team still needs production data, measurements, records, or observations to determine whether it actually contributed to the problem.</p><p>For a detailed explanation, see our guide to the <a href="https://flowfuse.com/blog/2026/07/ishikawa-fishbone-diagram/">Ishikawa Fishbone Diagram</a>.</p><h2 id="can-you-use-5-whys-and-fishbone-together">Can You Use 5 Whys and Fishbone Together?</h2><p>Yes. The two methods can work well as part of the same investigation.</p><p>A team can first use a Fishbone Diagram to capture the different factors that could have contributed to a problem. After checking those possibilities against available evidence, the team can use 5 Whys to investigate a specific cause in greater depth.</p><p>For example, a team investigating defective parts might identify possible causes related to the machine, material, method, and measurement.</p><p>If production data points to a machine-setting problem, the team can then use 5 Whys to investigate why the setting was wrong and why the process did not catch the issue earlier.</p><p>The workflow could look like this:</p><p><img alt="Root cause analysis workflow: problem, possible causes, evidence, 5 Whys, and root cause" data-zoomable="" src="https://flowfuse.com/blog/2026/09/images/root-cause-flow.png"/></p><p>The value of combining the methods is that you can explore the problem broadly before investigating a specific cause in more detail.</p><h2 id="dont-stop-at-the-first-plausible-cause">Don't Stop at the First Plausible Cause</h2><p>Finding an explanation is not the same as proving it is the root cause.</p><p>For example, saying "operator error" may describe what happened, but it does not explain why the process allowed the error to happen.</p><p>Was the <a href="https://flowfuse.com/blog/2026/07/digital-work-instruction/">work instruction</a> unclear? Was the operator properly trained? Was the right information available at the workstation? Could the process have prevented or detected the mistake?</p><p>These questions shift the investigation from the immediate event to the conditions that allowed it to occur.</p><p>A useful root cause should be supported by evidence and lead to a corrective action that addresses the underlying problem.</p><h2 id="which-should-you-use">Which Should You Use?</h2><p>If you already have a likely cause and can follow the evidence, start with 5 Whys. If the cause is unclear or you need to examine several possibilities, start with a Fishbone Diagram. If you need to explore several possibilities and then investigate one in depth, use both.</p><p>Whichever method you choose, base the investigation on evidence rather than assumptions.</p><h2 id="start-your-root-cause-analysis">Start Your Root Cause Analysis</h2><p>Once you know which approach fits the problem, the next step is to put it into practice. Use our <a href="https://flowfuse.com/blog/2026/09/five-whys-template/">5 Whys template</a> to work through a specific cause step by step, or use the <a href="https://flowfuse.com/blog/2026/09/ishikawa-fishbone-diagram-template/">Fishbone Diagram template</a> to map out possible causes with your team.</p><p><strong>Back Your Root Cause Analysis With Real Data</strong></p><p>See how FlowFuse connects machines, PLCs, and quality systems so your team can check suspected causes against production data instead of assumptions.</p><p><a href="https://flowfuse.com/book-demo/">Book a Demo</a></p>]]></content>
        <updated>2026-09-25T00:00:00.000Z</updated>
        <link href="https://flowfuse.com/blog/2026/09/5-whys-vs-fishbone-diagram/"/>
        
    </entry>
    <entry>
        <id>https://flowfuse.com/blog/2026/09/ppap/</id>
        <title>PPAP: How Suppliers Prove a Production Process Is Ready</title>
        <summary>PPAP provides evidence of a consistent process: It shows that a supplier's production process can consistently meet requirements during production, not just on a single sample. The 18 elements are interconnected: Design records define requirements, process controls define how the part is made, and data prove it. The PSW ties them together. The submission level depends on the customer: The customer's requirements set the level, with Level 3 common for new part introductions.</summary>
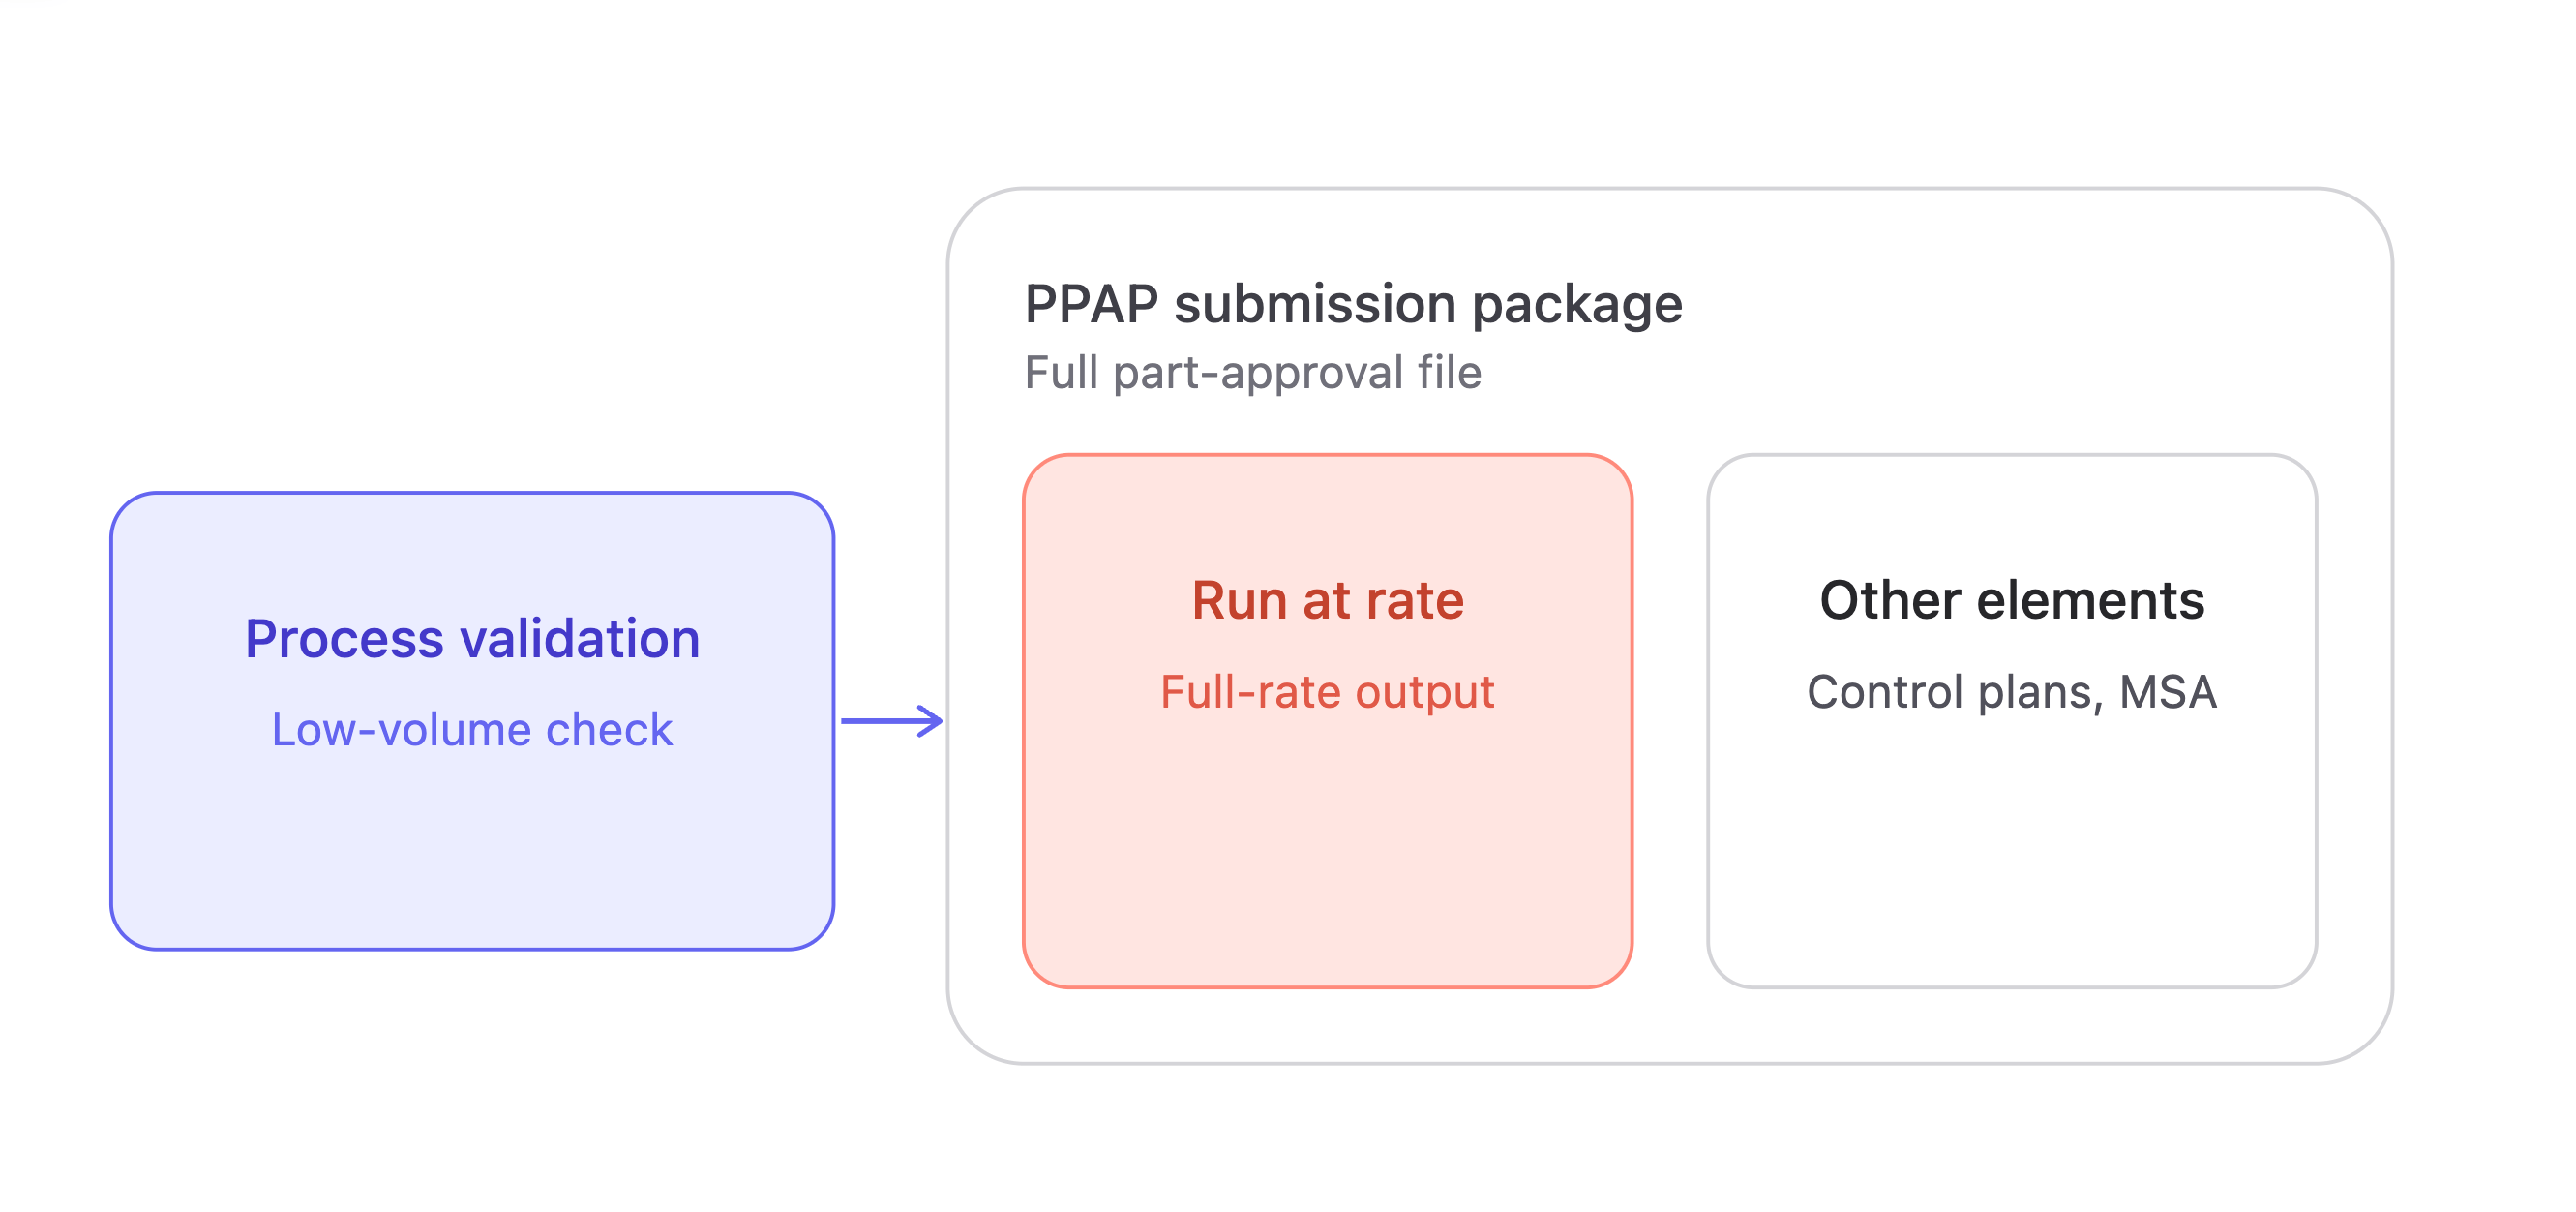
        <content type="html"><![CDATA[<p>A part can <a href="https://flowfuse.com/blog/2026/09/first-pass-inspection-fpa/">pass inspection</a> and still raise questions about whether the process can repeatedly produce the same part.</p><p>That is what PPAP answers. It combines design records, process controls, measurements, testing, and other evidence to show that a supplier is ready to produce the part to the customer's requirements.</p><p>Much of that evidence starts as <a href="https://flowfuse.com/blog/2026/07/defect-and-quality-monitoring/">quality data</a> on the shop floor, which FlowFuse captures directly from machines and gauges.</p><p>This article covers what PPAP is, its 18 elements, the submission level requirements, and the approval process, including what goes into the Part Submission Warrant (PSW).</p><h2 id="what-is-ppap">What Is PPAP?</h2><p>PPAP is the <a href="https://www.aiag.org/training-and-resources/manuals/details/PPAP-4" rel="nofollow">Production Part Approval Process</a>, a structured process that shows a supplier's production process can meet the customer's engineering and quality requirements on each run, not just on a single sample.</p><p>The Automotive Industry Action Group publishes PPAP as one of its <a href="https://www.aiag.org/expertise-areas/quality/quality-core-tools" rel="nofollow">Quality Core Tools</a>, alongside <a href="https://www.aiag.org/training-and-resources/manuals/details/APQP-3" rel="nofollow">APQP</a>, FMEA, MSA, and <a href="https://flowfuse.com/blog/2026/08/statistical-process-control/">SPC</a>.</p><p>PPAP is most associated with <a href="https://flowfuse.com/industries/automotive/">automotive manufacturing</a>, though other industries use similar part approval processes with different requirements.</p><a href="https://app.flowfuse.com/account/create"><img src="https://flowfuse.com/blog/2026/09/images/papp-cta.png" alt="Collect PPAP data as parts are made - sign up for FlowFuse"/></a><h2 id="the-18-elements-of-the-production-part-approval-process">The 18 Elements Of The Production Part Approval Process</h2><p>PPAP is made up of 18 elements covering the product and process, measurement systems, testing, samples, and approval. The table below puts them into four areas to show how they are related. The groups are not part of the PPAP requirements.</p><table><thead><tr><th></th><th><strong>PPAP Element</strong></th><th><strong>What It Covers</strong></th></tr></thead><tbody><tr><td><strong>Design &amp; Engineering Documentation</strong></td><td></td><td>Establishes what the part needs to be and documents the engineering requirements, approved changes, and potential design risks.</td></tr><tr><td>1</td><td>Design Records</td><td>Engineering specifications, drawings, dimensions, tolerances, materials, and other requirements the part needs to meet.</td></tr><tr><td>2</td><td>Engineering Change Documents</td><td>Documentation and approvals for engineering changes affecting the submitted part.</td></tr><tr><td>3</td><td>Customer Engineering Approval</td><td>Record of customer engineering approval when required for the part or an engineering change.</td></tr><tr><td>4</td><td>Design FMEA (DFMEA)</td><td>Analysis of potential product-design failure modes, their effects and causes, and the actions taken to reduce design risk.</td></tr><tr><td><strong>Process Planning &amp; Control</strong></td><td></td><td>Defines how the part will be manufactured and how potential process risks and important characteristics will be controlled.</td></tr><tr><td>5</td><td>Process Flow Diagram</td><td>The sequence of manufacturing, inspection, handling, and other operations used to produce the part.</td></tr><tr><td>6</td><td>Process FMEA (PFMEA)</td><td>Analysis of potential failures within the manufacturing process and the controls used to prevent or detect them.</td></tr><tr><td>7</td><td><a href="https://flowfuse.com/blog/2026/08/control-plans/">Control Plan</a></td><td>Production controls, measurements, specifications, sampling methods, and reaction plans used to control important product and process characteristics.</td></tr><tr><td><strong>Product &amp; Process Evidence</strong></td><td></td><td>Shows that production parts meet defined requirements and that the measurement, testing, and process controls provide the required results.</td></tr><tr><td>8</td><td><a href="https://www.itl.nist.gov/div898/handbook/mpc/section4/mpc4.htm" rel="nofollow">Measurement System Analysis (MSA)</a></td><td>Shows that the measurement systems used for product and process checks are suitable and provide reliable results.</td></tr><tr><td>9</td><td>Dimensional Results</td><td>Measurement results showing that production samples meet the dimensions and tolerances specified in the design record.</td></tr><tr><td>10</td><td>Material &amp; Performance Test Results</td><td>Results from required material, functional, performance, or other specified tests.</td></tr><tr><td>11</td><td>Initial Process Studies</td><td>Analysis of process performance or <a href="https://www.itl.nist.gov/div898/handbook/pmc/section1/pmc16.htm" rel="nofollow">capability</a> for selected characteristics during initial production runs, where required.</td></tr><tr><td>12</td><td>Qualified Laboratory Documentation</td><td>Documentation supporting the qualification of laboratories used to perform required testing.</td></tr><tr><td>13</td><td>Appearance Approval Report (AAR)</td><td>Approval of appearance characteristics such as color, texture, gloss, grain, or other visual requirements when applicable.</td></tr><tr><td><strong>Production Samples, Records &amp; Approval</strong></td><td></td><td>Brings together production samples, reference and inspection records, customer-specific requirements, and the formal documentation used to complete the PPAP submission.</td></tr><tr><td>14</td><td>Sample Production Parts</td><td>Parts produced using the intended production process, tooling, materials, and production environment as required.</td></tr><tr><td>15</td><td>Master Sample</td><td>An approved reference sample retained for comparison, inspection, or training, when applicable.</td></tr><tr><td>16</td><td>Checking Aids</td><td>Gauges, fixtures, templates, models, or other inspection aids used to verify the part.</td></tr><tr><td>17</td><td>Records of Compliance with Customer-Specific Requirements</td><td>Records demonstrating compliance with additional requirements defined by the customer, such as specific forms, tests, documentation, or submission rules.</td></tr><tr><td>18</td><td>Part Submission Warrant (PSW)</td><td>The formal document summarizing the PPAP submission and the supplier's declaration that the applicable requirements have been met.</td></tr></tbody></table><p>The elements are interconnected, not 18 separate documents. The Design Record defines what the customer requires. The Process Flow Diagram, PFMEA, and Control Plan define how the supplier will manufacture and control the part. MSA, dimensional results, testing, and initial process studies then show that the process and its controls are working as intended, and the Part Submission Warrant brings the submission together for customer review.</p><h2 id="ppap-levels-explained">PPAP Levels Explained</h2><p>PPAP defines five submission levels, each setting how much of the 18-element package the supplier submits to the customer. The customer defines the level, usually in the PPAP request, supplier manual, or purchase order. Anything not submitted is maintained by the supplier and made available if requested.</p><h3 id="ppap-level-1">PPAP Level 1</h3><p>Only the Part Submission Warrant (PSW) is submitted.</p><h3 id="ppap-level-2">PPAP Level 2</h3><p>The PSW, product samples, and limited supporting data are submitted.</p><h3 id="ppap-level-3">PPAP Level 3</h3><p>The PSW, product samples, and the complete supporting data package are submitted. Level 3 is commonly requested for new part introductions because it gives the customer the complete supporting data package without an on-site review.</p><h3 id="ppap-level-4">PPAP Level 4</h3><p>The PSW is submitted along with whatever other requirements the customer defines, so the contents vary from customer to customer.</p><h3 id="ppap-level-5">PPAP Level 5</h3><p>The PSW, product samples, and complete supporting data are reviewed at the supplier's manufacturing location.</p><h2 id="the-significant-production-run">The Significant Production Run</h2><p>The sample parts and data in a PPAP are pulled from a significant production run. Unless the customer specifies otherwise, the AIAG PPAP manual defines this as one to eight hours of production totaling at least 300 consecutive parts, made at the production site with the production tooling, gauging, materials, process, and operators.</p><p>Initial process studies are typically calculated from this run. Customer-specific requirements determine the acceptance criteria for these studies. Common capability criteria use thresholds such as a Cpk or Ppk of 1.33 or 1.67, depending on the characteristic and the customer.</p><h2 id="what-the-part-submission-warrant-includes">What The Part Submission Warrant Includes</h2><p>The PSW is the summary document the customer signs off on, and a separate PSW is generally completed for each part number unless the customer agrees otherwise. Typically, it records:</p><ul><li>Part number, part name, drawing number, and engineering change level</li><li>Part weight</li><li>The supplier's manufacturing site</li><li>The reason for submission, such as a new part, engineering change, or tooling change</li><li>The requested submission level</li><li>Whether dimensional, material and performance, appearance, and statistical results meet requirements</li><li>A declaration signed by an authorized supplier representative, including the production rate from the significant production run</li><li>A customer disposition field recording the approval decision</li></ul><h2 id="ppap-approval-status">PPAP Approval Status</h2><p>After the submission is reviewed, the customer records one of three dispositions defined in the <a href="https://www.aiag.org/training-and-resources/manuals/details/PPAP-4" rel="nofollow">AIAG PPAP manual</a>:</p><ul><li><strong>Approved:</strong> The part and process meet the customer's requirements, and the supplier is authorized to ship production quantities.</li><li><strong>Interim approval:</strong> Shipment is permitted for a limited time or quantity while open issues are resolved, typically under an action plan agreed with the customer. Full approval is still required.</li><li><strong>Rejected:</strong> The submission does not meet requirements. The supplier must correct the issues and resubmit before production shipments are authorized.</li></ul><h2 id="when-is-ppap-required">When Is PPAP Required?</h2><p>PPAP may be required when a change could affect how a part is made or how it performs. Each customer defines its specific submission triggers in its supplier manual, but most fall under a few categories.</p><p>The most common trigger is a new part, meaning a part number the supplier has never produced for that customer. An engineering or design change, such as a new drawing revision, tolerance, or material specification, also requires approval before the changed part ships.</p><p>Changes to how or where the part is made are treated the same way. These include a new manufacturing method or process sequence; new, replacement, or refurbished tooling; moving production to another line or plant; and switching to a new source for material or an outsourced operation. Many customers also require PPAP when production resumes on tooling that has been inactive for a long period, often 12 months or more.</p><p>A process correction after a significant quality problem can also trigger a new submission, typically as part of a <a href="https://flowfuse.com/blog/2026/09/capa-corrective-preventive-action/">corrective action</a>.</p><p>The supplier is expected to notify the customer before making any of these changes. The customer then decides whether a complete PPAP, a partial resubmission covering only the affected elements, or another form of approval is required.</p><h2 id="final-thoughts">Final Thoughts</h2><p>PPAP boils down to documented evidence that a production process can consistently meet requirements at production rates. Approval is commonly followed by a <a href="https://flowfuse.com/blog/2026/08/safe-launch/">safe launch</a> period, where the customer checks that proof against full production.</p><p>For manufacturers running several plants, most of the work goes into gathering that evidence. Dimensional results, test data, and capability studies sit in gauges, inspection systems, and <a href="https://flowfuse.com/blog/2025/06/what-is-mes/">MES</a> platforms, and are typically copied into spreadsheets by hand before each submission. With FlowFuse, teams capture those measurements during production, <a href="https://flowfuse.com/blog/2026/08/automotive-traceability/">tied to each part</a>. Once the pipeline is established, FlowFuse lets them roll it out to other plants and secure and manage every deployment from one place.</p><p><strong>Stop Rebuilding PPAP Data in Spreadsheets</strong></p><p>See how FlowFuse captures dimensional, test, and capability data from your gauges and inspection systems as parts are produced, ready for every submission at every plant.</p><p><a href="https://flowfuse.com/book-demo/">Book a Demo</a></p>]]></content>
        <updated>2026-09-24T00:00:00.000Z</updated>
        <link href="https://flowfuse.com/blog/2026/09/ppap/"/>
        
    </entry>
    <entry>
        <id>https://flowfuse.com/blog/2026/09/ai-in-manufacturing/</id>
        <title>AI in Manufacturing: Use Cases, Software, and Implementation</title>
        <summary>AI in manufacturing is applied to machine, PLC, sensor, camera, MES, and SCADA data to predict failures, detect defects, optimize processes, and support production decisions. Putting a model into production takes more than the model itself: it needs industrial data connectivity, somewhere to run it, and a way to deliver results to the people and systems that act on them.</summary>
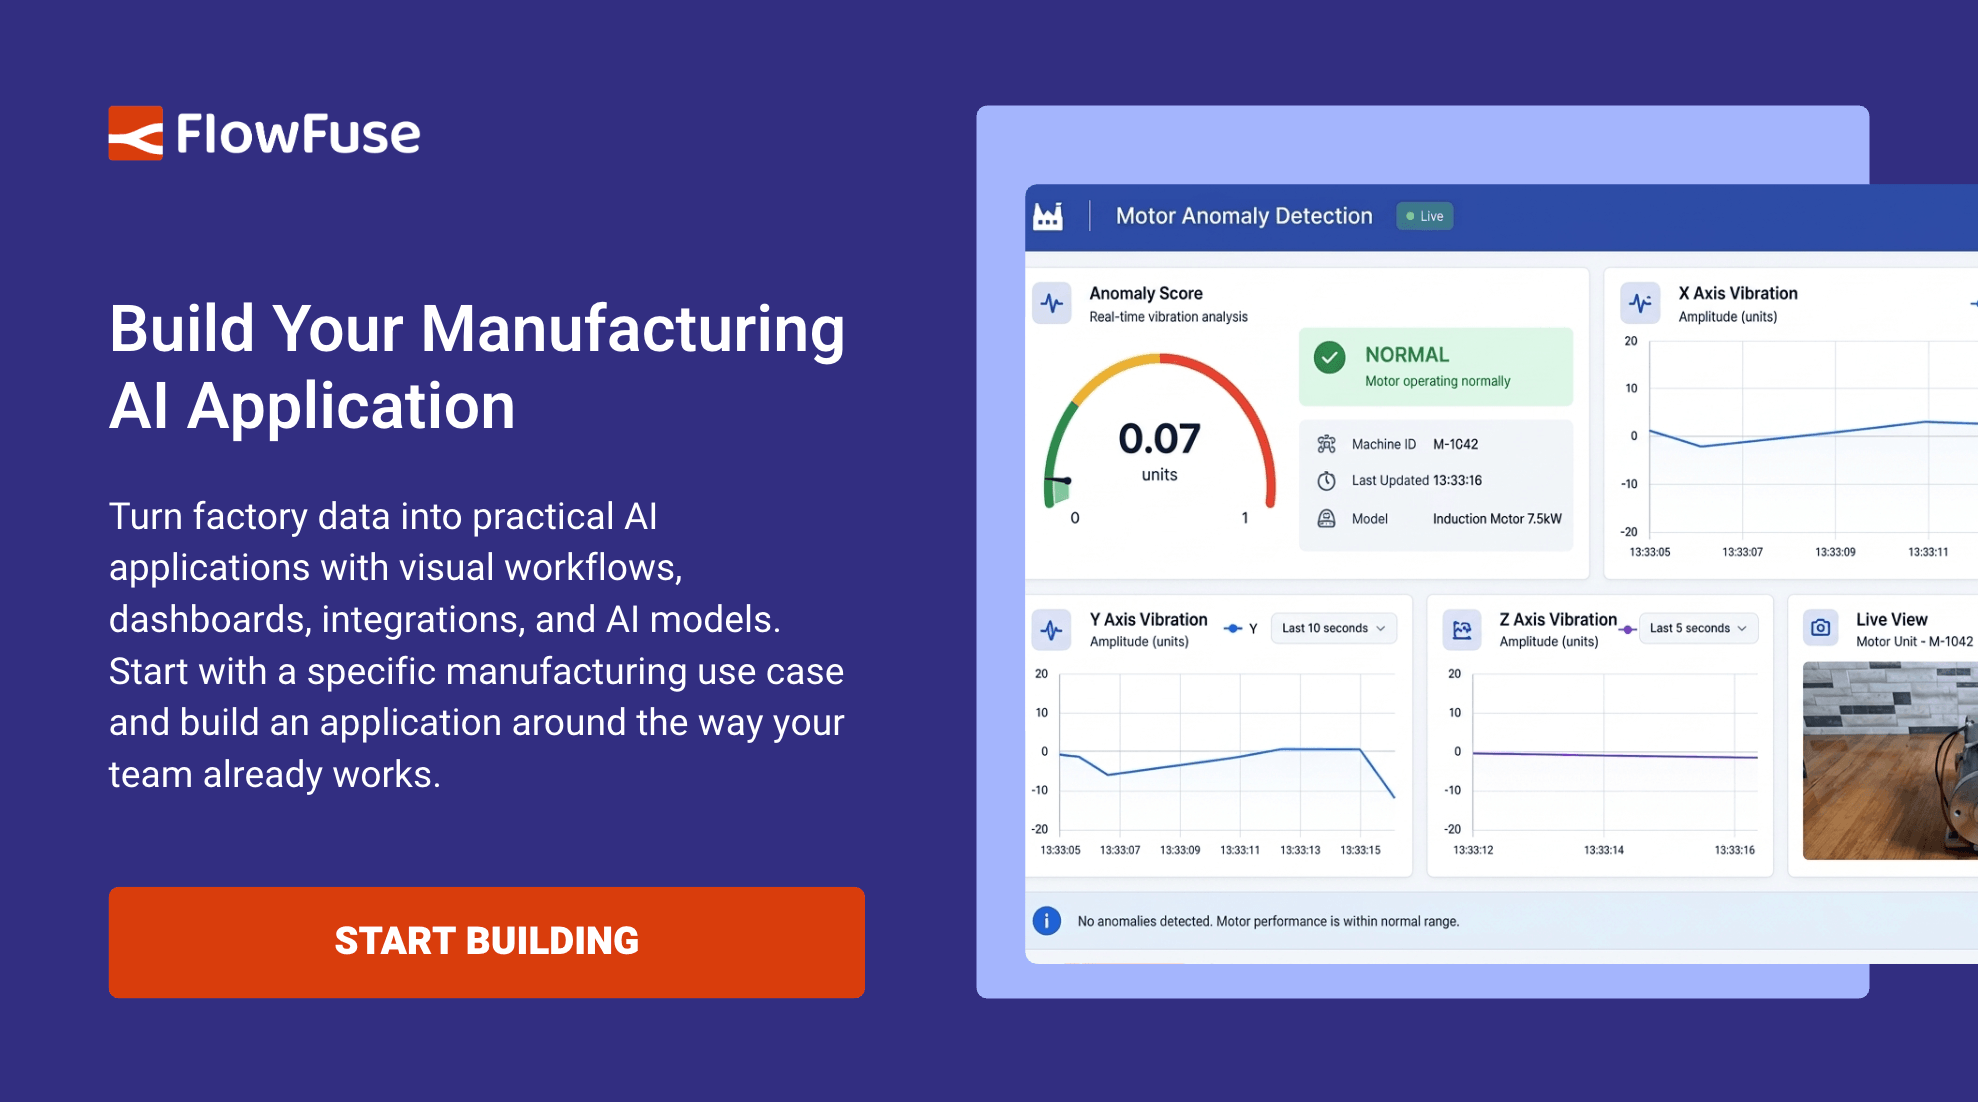
        <content type="html"><![CDATA[<p>AI is being used in manufacturing to predict equipment failures, detect defects, optimize processes, and help operators and engineers make better production decisions. These applications use data from machines, PLCs, sensors, cameras, MES, SCADA, and other factory systems.</p><p>Implementing AI in a manufacturing environment is more than selecting the right model. It requires connecting data, building applications, and bringing results to where they can have the most impact. This article covers the <a href="#common-use-cases-of-ai-in-manufacturing">main use cases for AI in manufacturing</a>, the <a href="#software-stack-for-ai-in-manufacturing">software required</a>, and <a href="#how-to-implement-ai-in-manufacturing">how to implement AI</a> in production.</p><a href="https://app.flowfuse.com/account/create"><img src="https://flowfuse.com/blog/2026/09/images/ai-in-manufacturing-cta-1.png" alt="Connect your factory data to an AI application with FlowFuse - start your free trial"/></a><h2 id="what-is-ai-in-manufacturing">What Is AI in Manufacturing?</h2><p>AI stands for artificial intelligence. It encompasses technologies that enable learning from data, recognizing patterns, making predictions, and performing tasks that require human intelligence.</p><p>Applied to manufacturing, AI can analyze production data to detect anomalies and defects, predict equipment failures, optimize processes, and support production decisions.</p><h2 id="common-use-cases-of-ai-in-manufacturing">Common Use Cases of AI in Manufacturing</h2><p>AI can be applied to many aspects of a manufacturing operation. The particular use case depends on the process, the problem to be addressed, and the data involved.</p><p>At a high level, AI can help manufacturers <strong>predict</strong> what may happen, <strong>detect</strong> problems as they occur, <strong>optimize</strong> processes and resources, <strong>assist</strong> operators and engineers through applications and analysis, and <strong>automate</strong> repetitive tasks. These capabilities span equipment maintenance, quality inspection, process optimization, and support for operators and engineers.</p><h3 id="predictive-maintenance">Predictive Maintenance</h3><p>Equipment availability is one of the most critical metrics in manufacturing, and unplanned downtime is costly. Predictive maintenance uses AI to estimate when a machine is likely to fail, so maintenance can be scheduled before it does.</p><p>The model analyzes machine data over time to find patterns associated with equipment degradation. For example, it might analyze vibration, temperature, and current data from a motor to detect changes that predict a bearing is starting to wear. Maintenance teams can use that signal to investigate early, order parts in advance, and schedule the work during planned downtime rather than after a breakdown.</p><h3 id="anomaly-detection">Anomaly Detection</h3><p>Anomaly detection is similar to predictive maintenance, but it answers a different question. Instead of predicting a specific failure, it flags when equipment has stopped behaving normally, and it doesn't need examples of past failures to do it.</p><p>The model learns what normal looks like from signals such as temperature, pressure, vibration, current consumption, and cycle time, then raises an alert when readings stray from that pattern. Since it only needs normal operating data, it's a practical starting point when failures are rare or poorly documented.</p><p>For example, an AI-powered <a href="https://flowfuse.com/blog/2026/02/motor-anomaly-detector-ai/">motor anomaly detector built with FlowFuse</a> can detect abnormal behavior in a motor's current consumption, so teams can investigate before the issue turns into a larger production problem.</p><h3 id="quality-inspection">Quality Inspection</h3><p>The same pattern recognition can be used to inspect product quality. AI-powered vision systems can detect defects, variations, or other characteristics that are hard to catch consistently through manual inspection.</p><p>For example, a camera can capture each product as it exits a conveyor while a vision model checks for surface defects. The results can be used to sort defective products and reveal recurring issues that point back to a particular machine, tool, or material batch.</p><h3 id="process-and-energy-optimization">Process and Energy Optimization</h3><p>Process optimization is about making production itself as efficient as possible. AI can analyze process variables to see which ones contribute the most to the outcome, for example machine speed, temperature, material feed rate, and energy use, to find the combination that delivers the required output with the least waste.</p><p>Energy is a typical optimization target, since it's often one of the largest controllable costs. AI can flag wasteful energy usage such as idling equipment or compressed air leaks, and help shift flexible loads to lower-cost periods. These optimizations are typically measured in terms of energy per unit produced.</p><h3 id="demand-forecasting">Demand Forecasting</h3><p>AI can find patterns in historical demand data that indicate future trends. Manufacturers can use this to estimate demand for particular products or components in the coming weeks and months, accounting for seasonality, promotions, and market changes.</p><h3 id="production-planning-and-scheduling">Production Planning and Scheduling</h3><p>Building on demand forecasts, AI can help decide what to produce, when, and on which line. It can sequence orders, balance workloads, anticipate material shortages, and re-plan when a machine goes down or a rush order arrives.</p><p>The value is in handling many constraints at once, such as machine availability, changeover times, material lead times, and delivery dates. Many teams start with recommendations that a planner reviews before moving toward automated scheduling.</p><h3 id="digital-twins-and-simulation">Digital Twins and Simulation</h3><p>Digital twins create virtual representations of machines, production lines, or processes using data from their physical counterparts. AI can analyze this data to identify patterns, predict outcomes, and test “what if” scenarios, such as changes to line speed or production settings, before applying them to the real process.</p><p>Simulation can also supplement real-world data when failures are rare or difficult to capture. These applications are typically most valuable for complex or high-value processes where testing changes in production is costly or risky.</p><h3 id="operator-assistance">Operator Assistance</h3><p>Operators, engineers, maintenance staff, and quality teams spend a lot of time searching for information: what an alarm means, what the procedure is, whether it's happened before. AI can shorten that search.</p><p>For example, when a machine raises an alarm, an operator can ask an AI assistant to explain the likely cause, pull the relevant troubleshooting procedure from a knowledge base, and surface recent data from that machine for review. The same approach works at a plant-wide level, where an engineer can ask which lines are underperforming this week and get an explanation of what's driving the gap.</p><h2 id="software-stack-for-ai-in-manufacturing">Software Stack for AI in Manufacturing</h2><p>AI is only one part of an AI application in manufacturing. To put a model into production, manufacturers also need software to collect and connect machine data, process and store it, run the model, and deliver its results to the systems and people who need them.</p><a href="https://flowfuse.com/book-demo/"><img src="https://flowfuse.com/blog/2026/09/images/ai-in-manufacturing-cta-2.png" alt="See how FlowFuse fits into an AI application's software stack - talk to our team"/></a><h3 id="industrial-data-and-connectivity">Industrial Data and Connectivity</h3><p>An AI application needs data, which comes from sources including <a href="https://flowfuse.com/landing/plc/">machines and PLCs</a>, sensors, <a href="https://flowfuse.com/use-cases/mes/">MES</a>, <a href="https://flowfuse.com/use-cases/scada/">SCADA</a>, <a href="https://flowfuse.com/docs/node-red/database/">databases</a>, <a href="https://flowfuse.com/blog/2026/06/process-rtsp-camera-feeds-at-the-edge/">cameras</a>, and more.</p><p>Industrial connectivity software gathers this data and makes it available to the AI application. <a href="https://flowfuse.com/use-cases/data-integration/">FlowFuse connects industrial equipment and routes this data through the application</a>, which is essential for processing it. Its <a href="https://flowfuse.com/docs/user/teambroker/">built-in MQTT broker</a> can also act as the central hub where this data is published and made available to the AI application and other systems.</p><h3 id="edge-and-cloud-computing">Edge and Cloud Computing</h3><p>AI applications need computing resources to run models and generate predictions or other outputs. That computation can happen close to the machine at the edge or in the cloud, depending on the requirements of the workload.</p><p>Edge AI is useful where inference needs to happen with low latency and without a network connection, while cloud AI can provide access to more compute for demanding workloads. FlowFuse supports AI applications across both environments, running AI alongside industrial applications at the edge and connecting flows to cloud-hosted AI services when required.</p><h3 id="ai-and-machine-learning">AI and Machine Learning</h3><p>The AI component itself depends on the use case, since it needs to be trained to perform a particular task such as predicting demand, detecting anomalies, or optimizing a process.</p><p>Various AI and machine learning software can implement these functions. For example, FlowFuse can run an ONNX machine learning model on an edge device using the <a href="https://flowfuse.com/docs/flowfuse-nodes/ai/onnx/">ONNX node</a>.</p><h3 id="data-storage">Data Storage</h3><p>Depending on the application, data may need to be stored for later use, such as training models or displaying results to users. Various types of databases, including SQL and NoSQL, can be used for this.</p><p>FlowFuse can connect to databases already in use in the manufacturing environment, and also provides a <a href="https://flowfuse.com/docs/flowfuse-nodes/flowfuse-tables/">built-in database</a> for storing operational data.</p><h3 id="applications-and-workflows">Applications and Workflows</h3><p>Finally, for an AI application to have an effect, its results need to reach the people and systems that can act on them. That could be a dashboard showing predicted demand, an alert indicating a machine is about to fail, or a maintenance task created automatically when an anomaly is detected.</p><p>FlowFuse provides a visual application development environment for building these applications and workflows and connecting them to industrial data. FlowFuse also integrates with AI agents, allowing <a href="https://flowfuse.com/docs/user/expert/">FlowFuse Expert</a> and a coding agent of your choice to interact with the platform and build applications and data workflows through its MCP server and <a href="https://flowfuse.com/docs/flowfuse-nodes/mcp/">MCP nodes</a>. This is how <a href="https://flowfuse.com/blog/2026/09/industrial-ai-agent/">external AI services such as Claude, OpenAI, and Gemini connect to FlowFuse</a> to work with manufacturing data and applications.</p><p>Not every application needs the full stack; it depends on the problem you're solving. At minimum, you need industrial data connectivity, somewhere to run the model, and the model itself. Beyond that, some applications also need data storage, dashboards, workflows, or AI assistants before the results can actually close the loop.</p><h2 id="how-to-implement-ai-in-manufacturing">How to Implement AI in Manufacturing</h2><p>A successful manufacturing AI project starts with a clear production problem, not an AI model. In practice, implementation can be approached in five stages:</p><ol><li>Define the outcome. Decide what you want to improve: reduce downtime, detect defects, increase throughput, help operators troubleshoot equipment faster. A specific, measurable outcome makes the project easier to scope and evaluate.</li><li>Validate the data. Identify the data needed to support the use case and confirm it's available and collected consistently.</li><li>Pilot a focused use case. Connect the relevant factory systems and test the AI on one machine, line, or process rather than across the entire plant. Starting small makes it easier to validate results, measure impact, and catch data or integration issues before scaling.</li><li>Put results into the workflow. Once results are validated, connect them to where people can act on them: a dashboard that displays a prediction, an alert that indicates a likely failure, or a maintenance task created automatically when an anomaly is detected. A prediction only creates value when someone can act on it.</li><li>Monitor and iterate. Treat the application as part of normal operations, not a one-time deployment. Equipment, processes, and production conditions change over time, and the models and applications built around them may need updating as new data becomes available.</li></ol><p>The objective isn't to add AI for its own sake, but to apply it where it produces a measurable improvement in a real manufacturing process.</p><p><strong>Connect Your Factory Data to an AI Application</strong></p><p>Talk to the FlowFuse team about connecting your machines, PLCs, and factory systems to the AI use case you're evaluating.</p><p><a href="https://flowfuse.com/contact-us/">Contact Us</a></p>]]></content>
        <updated>2026-09-23T00:00:00.000Z</updated>
        <link href="https://flowfuse.com/blog/2026/09/ai-in-manufacturing/"/>
        
    </entry>
    <entry>
        <id>https://flowfuse.com/blog/2026/09/automotive-mes/</id>
        <title>Automotive MES: Buy, Build, or Extend What You Have</title>
        <summary>Off-The-Shelf And Custom MES Both Leave Plant-Specific Gaps: Most automotive manufacturers don't fail on routing and dispatch; they fail on the plant-specific quality gates, genealogy, and downtime coding that off-the-shelf and custom-built MES both leave for each site to configure. Buying Is Fast To Start, Building Only Pays Off If You'll Maintain It: Buying gets routing, dispatch, and error-proofing running fast, but quality gates and genealogy still take months to configure on top. Building only pays off for a differentiated process with a team in place to maintain it. Extending Closes The Gap Without Replacing What Already Works: Extending is usually fastest when the core MES already works, and the real gaps are quality gates, genealogy, and downtime standardization, without replacing anything running the plant.</summary>
        <content type="html"><![CDATA[<h2 id="what-automotive-mes-actually-does">What Automotive MES Actually Does</h2><p>A Manufacturing Execution System (MES) sits between two systems every plant already runs. ERP plans production at the scale of days and weeks: what to build, how much, by when. SCADA supervises the equipment below it, collecting tag data from PLCs in real time. MES is the layer in between, taking the ERP plan, dispatching it as work orders, and tracking execution as it happens.</p><h3 id="from-monolithic-mes-to-modular-mes">From Monolithic MES to Modular MES</h3><p>For most of MES's history, the entire stack shipped as one tightly coupled platform (hence the term ‘monolith’). Changing any piece meant touching the whole system: a vendor engagement and months of lead time for custom configurations.</p><p>That model is breaking down for the same reason why automotive plants are hard to standardize in the first place. Every plant, product line, and OEM contract has its own quality requirements, downtime taxonomy, and mix of legacy equipment. The industry's response has been a shift toward modular, composable MES architecture that breaks routing, quality, genealogy, and downtime tracking into pieces that can be built or replaced independently. Extending an existing MES, the third option here, is that same shift applied to a plant that already has a working MES and no interest in replacing it just to get modularity.</p><h2 id="why-automotive-manufacturing-makes-mes-decisions-harder">Why Automotive Manufacturing Makes MES Decisions Harder</h2><p>Automotive manufacturing carries more accumulated technical debt than most manufacturing environments, and it's structural, not incidental. Equipment spans decades, so a single line can mix PLCs from different vendors and eras never built to talk to each other. Plants added through M&amp;A bring their own MES instances, ERP configurations, and naming conventions with them. Every integration is custom and manual, usually an integrator writing point-to-point code for one connection at one plant that nobody else can safely touch, and when that engineer leaves, it's a real risk.</p><p>None of this is unique to any specific manufacturer. It's the normal condition of any automotive manufacturer or supplier, and it's exactly why a corporate rollout can't assume one MES configuration fits every site.</p><h2 id="the-real-decision-buy-build-or-extend">The Real Decision: Buy, Build, or Extend</h2><h3 id="when-buying-an-off-the-shelf-mes-is-right">When Buying an Off-the-Shelf MES Is Right</h3><p>An off-the-shelf MES is the fastest path to solid routing, dispatch, and out-of-box error-proofing. It's right when a plant runs a standardized process, has no system yet, and needs core execution running quickly. Cost varies a lot by architecture and market: on-premise systems typically run $120,000 to $600,000 upfront, plus around 20% of license cost annually in maintenance, with six to eighteen months before going live, while cloud-native platforms start in the low thousands per month (<a href="https://www.symestic.com/en-us/blog/mes-system-prices-2026" rel="nofollow">Symestic, 2026</a>). In the UK, a cloud MES typically runs £6,000 to £15,000 a year with a 90-day go-live, against £75,000 to £150,000 to implement on-premise and three-year totals of £120,000 to £450,000 (<a href="https://totalcontrolpro.com/guides/the-end-of-the-production-black-box-how-much-does-a-modern-mes-really-cost/" rel="nofollow">TotalControlPro, 2025</a>).</p><p>There are plenty of strong MES platforms on the market, from comprehensive systems like <a href="https://www.siemens.com/en-us/products/opcenter/execution/" rel="nofollow">Siemens Opcenter Execution</a> and <a href="https://www.rockwellautomation.com/en-us/products/software/factorytalk/operationsuite/mes/plex-mes.html" rel="nofollow">Rockwell's Plex</a>, to composable, build-your-own-app platforms like <a href="https://tulip.co/" rel="nofollow">Tulip</a>. Manufacturers running these don't need to rip them out to close the gaps this blog covers. In practice, manufacturers have implemented FlowFuse alongside deployments like these to extend their functionality, which is what the next option is about.</p><a href="https://flowfuse.com/book-demo/"><img src="https://flowfuse.com/blog/2026/09/images/extend-the-capablities-of-mes.png" alt="FlowFuse Extends capablities of your mes cta"/></a><h3 id="when-building-a-custom-mes-is-right">When Building a Custom MES Is Right</h3><p>Building makes sense when a process is differentiated enough that no off-the-shelf platform fits it, and the organization has the capacity to own it long term, not just ship it once. The trade-off is real: a custom build competes with the IT roadmap for a year or more, and every future change depends on that same team staying in place. Hexagon Manufacturing Intelligence took this route, building its own Smart Factory Manager rather than buying off-the-shelf, after concluding the fit and long-term ownership were worth the investment (<a href="https://www.industryweek.com/technology-and-iiot/video/55296538/build-or-buy-your-mes-lessons-from-hexagon-manufacturing-intelligence" rel="nofollow">IndustryWeek, 2025</a>).</p><h3 id="when-extending-your-existing-mes-is-the-right-move">When Extending Your Existing MES Is The Right Move</h3><p>Extending is right when the core MES already works, and the actual gaps are plant-specific: a quality gate that enforces a specific <a href="https://flowfuse.com/blog/2026/08/control-plans/">control plan</a>, a genealogy structure that satisfies a specific OEM's <a href="https://flowfuse.com/blog/2026/08/safe-launch/">safe launch requirements</a>, a downtime taxonomy that matches how a plant fails. Those are the pieces that get patched together in scripts and spreadsheets when nobody builds them properly, and what a modular extension layer standardizes.</p><p>This is where FlowFuse fits, and it's worth being direct: FlowFuse is not an <a href="https://flowfuse.com/use-cases/mes/">MES</a>, and it doesn't compete with the one already running the plant. It's an application layer that connects to <a href="https://flowfuse.com/blog/2025/06/what-is-mes/">MES</a>, <a href="https://flowfuse.com/landing/enterprise-integration/">ERP</a>, and <a href="https://flowfuse.com/use-cases/scada/">SCADA</a> systems already in place and makes them more configurable at the plant level.</p><p>It's also worth naming a fact that shapes this whole decision: to our knowledge, no vendor sells an MES built and sold specifically as an automotive-only product. MES platforms are horizontal, enterprise-wide systems used across automotive, pharma, food and beverage, and electronics alike, not vertical-specific products with a separate automotive SKU. That's why customizing your existing MES is often the more practical path:</p><ul><li>Capturing torque measurements across the chassis line with poka-yoke checks that stop the station before a bad fastener moves downstream, then standardizing that application for other lines like powertrain.</li><li>Measuring operator productivity at one plant and rolling that application out across all sites so data flows into a standard dashboard without manual reconciliation.</li><li>Automating genealogy capture, binding component lots to serial numbers, for one vehicle program, then extending that logic to additional programs or plants instead of running a custom integration project each time.</li><li>Adding real-time quality gate enforcement, control plan limits with automatic hold-and-containment, to a line where the base MES configuration lacks it, then standardizing that pattern across other lines and plants building for the same OEM, even though each site submits its own PPAP per part number.</li></ul><h2 id="where-the-gaps-are-and-what-extension-needs-to-cover">Where the Gaps Are, and What Extension Needs to Cover</h2><p>Routing and dispatch are the core of what a packaged MES sells, and an extension layer doesn't need to touch that logic. FlowFuse supports <a href="https://flowfuse.com/use-cases/it-ot-middleware/">IT/OT connectivity</a> that layers on top of existing MES routing, adding what a packaged system leaves as a gap.</p><p>The gaps themselves cluster into two categories: quality gate enforcement (capturing a measurement, holding the station when a control-plan rule trips, routing the part to containment, and logging it against the serial number) and standardization across sites (a shared downtime taxonomy and genealogy captured at the point of consumption, so a reason code or a build record means the same thing at every plant). Unplanned downtime alone costs industrial manufacturers an estimated $50 billion annually (<a href="https://www.forbes.com/councils/forbestechcouncil/2022/02/22/unplanned-downtime-costs-more-than-you-think/" rel="nofollow">Forbes Technology Council, 2022</a>), and without standardization, a recall investigation ends up tracing the same defect to a shift's production at one plant and specific serial numbers at another.</p><h2 id="final-thoughts">Final Thoughts</h2><p>So where do we go from here? It honestly depends on how fast you want to see results and the availability of your existing resources.</p><p>If the core MES is good, a manufacturer can use FlowFuse to extend its existing capabilities rather than replace it, closing the quality gate, genealogy, and downtime gaps most vendors leave for each plant to solve on its own. FlowFuse gives IT and operations teams a way to build custom applications, <a href="https://flowfuse.com/blog/2026/05/manufacturing-software-built-in-stages/">starting small and expanding from there</a>, instead of reconfiguring the same enforcement at every site. It's part of FlowFuse's broader <a href="https://flowfuse.com/industries/automotive/">automotive manufacturing solutions</a>, used by 30+ automotive manufacturers in 20 countries.</p><h2 id="sources">Sources</h2><ul><li>Forbes Technology Council. (2022). <a href="https://www.forbes.com/councils/forbestechcouncil/2022/02/22/unplanned-downtime-costs-more-than-you-think/" rel="nofollow">"Unplanned downtime costs more than you think."</a></li><li>Symestic. (2026). <a href="https://www.symestic.com/en-us/blog/mes-system-prices-2026" rel="nofollow">"MES System Prices 2026: Cost Comparison, TCO &amp; ROI."</a></li><li>TotalControlPro. (2025). <a href="https://totalcontrolpro.com/guides/the-end-of-the-production-black-box-how-much-does-a-modern-mes-really-cost/" rel="nofollow">"The End of the Production Black Box: How Much Does a Modern MES Really Cost?"</a></li><li>IndustryWeek. (2025). <a href="https://www.industryweek.com/technology-and-iiot/video/55296538/build-or-buy-your-mes-lessons-from-hexagon-manufacturing-intelligence" rel="nofollow">"Build or Buy Your MES? Lessons from Hexagon Manufacturing Intelligence."</a></li></ul><p><strong>See how FlowFuse works in real environments</strong></p><p>Walk through real use cases and see how teams connect systems, automate workflows, and deploy at scale.</p><p><a href="https://flowfuse.com/book-demo/">Book a Demo</a></p>]]></content>
        <updated>2026-09-22T00:00:00.000Z</updated>
        <link href="https://flowfuse.com/blog/2026/09/automotive-mes/"/>
        
    </entry>
    <entry>
        <id>https://flowfuse.com/blog/2026/09/five-whys-template/</id>
        <title>5 Whys Analysis Template: Free Download</title>
        <summary>Download a free 5 Whys template to document problems, root causes, corrective actions, and verification.</summary>
        <content type="html"><![CDATA[<p>A <a href="https://flowfuse.com/blog/2025/12/five-whys-root-cause-analysis-definition-examples/">5 Whys</a> template gives your team a consistent structure to run a root cause analysis without missing a step or drifting into guesswork.</p><p>A good template keeps the analysis disciplined: one problem statement, one causal chain, evidence at every step, and a corrective action with an owner and a due date.</p><p><em>Download the free template below to give your team a consistent way to run a 5 Whys analysis and document it for corrective action tracking.</em></p><h2 id="what-should-be-on-a-5-whys-template">What Should Be on a 5 Whys Template?</h2><p>A 5 Whys template only needs a few fields, each filled in with something you can verify rather than an assumption:</p><ul><li><strong>Problem statement:</strong> What happened, where, when, and how you know it.</li><li><strong>Why 1–5 (as needed):</strong> Each answer builds on the one before it. Stop once you reach something fixable at a systemic level.</li><li><strong>Root cause:</strong> The systemic gap the chain of whys points to.</li><li><strong>Corrective action:</strong> The specific fix, an owner, and a due date.</li><li><strong>Verification:</strong> Confirmation, at a later date, that the fix actually held.</li></ul><p>Not every analysis needs all five whys filled in, and some need more than five. The fields matter more than the count.</p><h2 id="how-to-fill-in-a-5-whys-template">How to Fill In a 5 Whys Template</h2><p>Each answer should be specific enough that someone reading it later, without having been in the room, understands exactly what was found.</p><table><thead><tr><th>Avoid</th><th>Better</th></tr></thead><tbody><tr><td>Operator error</td><td>The torque tool had not been recalibrated after its 90-day interval</td></tr><tr><td>Machine broke</td><td>The bearing seized from insufficient lubrication, confirmed by the oil flow log</td></tr><tr><td>Process issue</td><td>The work instruction was not updated after the March engineering change</td></tr></tbody></table><p>The goal is an answer that is <strong>objective and traceable to evidence</strong> (a log, a measurement, a witness), not a label that just restates the problem.</p><h2 id="_5-whys-template-example">5 Whys Template Example</h2><p>Consider a line that produced 40 rejected units during a single shift.</p><p>The team fills in the problem statement with the exact count, shift, and defect type rather than "quality issue on Line 3." Each why is answered with something checked on the floor, not a guess, until the chain reaches a worn sensor that was past its replacement interval. The corrective action gets an owner and a due date, and a follow-up entry on the template confirms the replacement held during the next production run.</p><p>The template makes this process repeatable across shifts and lines without each team reinventing the format.</p><h2 id="keep-the-template-simple">Keep the Template Simple</h2><p>A 5 Whys template should stay simple enough to fill out during the analysis itself, not after the fact from memory.</p><p>Resist adding fields for every possible category of information. If a template starts accumulating sign-off boxes, severity ratings, and cost fields beyond the owner and due date, it has drifted from a root cause tool into a different kind of form. Keep it to the problem, the chain of whys, the root cause, and the corrective action.</p><p><strong>Connect Production Data to Corrective Actions</strong></p><p>See how FlowFuse connects machine and process data with quality workflows so your team can track corrective actions and verify that fixes work.</p><p><a href="https://flowfuse.com/book-demo/">Book a Demo</a></p>]]></content>
        <updated>2026-09-18T00:00:00.000Z</updated>
        <link href="https://flowfuse.com/blog/2026/09/five-whys-template/"/>
        
    </entry>
    <entry>
        <id>https://flowfuse.com/blog/2026/09/ishikawa-fishbone-diagram-template/</id>
        <title>Fishbone Diagram Template: Free Download</title>
        <summary>Download a free fishbone (Ishikawa) diagram template to sort possible causes into categories, then verify the top suspects with data.</summary>
        <content type="html"><![CDATA[<p>A <a href="https://flowfuse.com/blog/2026/07/ishikawa-fishbone-diagram/">fishbone diagram</a> template gives your team a fish shape to draw on instead of a blank whiteboard, so the session starts with brainstorming instead of formatting.</p><p>Unlike a <a href="https://flowfuse.com/blog/2025/12/five-whys-root-cause-analysis-definition-examples/">5 Whys</a> template, which documents one causal chain going deep, a fishbone template holds several categories side by side going wide. That shape is the whole point: it's built for the moment you don't yet know where a problem lives. If you're not sure which method fits your problem, see <a href="https://flowfuse.com/blog/2026/09/5-whys-vs-fishbone-diagram/">5 Whys vs. fishbone diagram</a>.</p><p><em>Download the free template below and use it the next time your team needs to brainstorm causes across categories, not drill into one.</em></p><h2 id="fishbone-diagram-parts">Fishbone Diagram Parts</h2><p>A fishbone template is really just four zones, each doing a different job:</p><ul><li><strong>The head:</strong> a single problem statement, specific enough that "what happened, where, and how often" are all answered in one sentence.</li><li><strong>The spine:</strong> the line running into the head. It doesn't hold information, it just gives the ribs somewhere to attach.</li><li><strong>The ribs:</strong> four to six categories branching off the spine. The 6Ms (Manpower, Method, Machine, Material, Measurement, Mother Nature) are the manufacturing default, not a requirement, rename or drop any that don't match your process.</li><li><strong>The branches:</strong> the specific, checkable causes hanging off each rib, plus a note on which ones you later verified against data.</li></ul><p>An empty rib isn't a gap to fill. It means that category doesn't apply to this problem, and forcing entries into it just to fill the space adds noise, not signal.</p><h2 id="how-to-fill-out-the-template">How to Fill Out the Template</h2><p>The most common way teams misuse the template is drilling into the first plausible cause the moment someone suggests it. That collapses a breadth tool into a narrow one before it's done its job.</p><p>Work one rib at a time and exhaust it before moving to the next: everything Machine-related, then everything Material-related, and so on. Only once every rib has been brainstormed should the team circle the two or three strongest branches and hand those to a depth tool like the 5 Whys.</p><p>Vague branches defeat the exercise just as fast as skipping ribs does:</p><table><thead><tr><th>Avoid</th><th>Better</th></tr></thead><tbody><tr><td>Machine issue</td><td>Print head height drifted out of spec last week</td></tr><tr><td>Bad material</td><td>New ink supplier introduced two weeks ago</td></tr><tr><td>Training</td><td>Night shift not trained on the new ink's dry time</td></tr></tbody></table><p>A branch should be <strong>specific and testable</strong>, not a category name repeated back as if it were an answer.</p><h2 id="example">Example</h2><p>A packaging line is rejecting cartons because the printed date code is smearing, that's the head. Working rib by rib, the team notes a drifted print head under Machine, a new ink supplier under Material, an unwritten cleaning interval under Method, and rising plant humidity since an HVAC repair under Mother Nature. No single rib explains it alone.</p><p>Two branches stand out once all six are filled: the new ink and the humidity shift. Those are the ones worth verifying against a log or measurement, not whichever one came up first.</p><h2 id="using-the-template-for-different-problems">Using the Template for Different Problems</h2><p>The categories on this template are meant to be edited, not treated as fixed. A service outage will need ribs that look nothing like a factory floor's, and that's expected. What should stay constant across every use is the shape: a specific head, ribs that actually apply, and branches specific enough to check against real data rather than restating the category they sit under.</p><p><strong>Verify Which Suspected Cause Is Real</strong></p><p>See how FlowFuse connects PLCs, sensors, and quality systems so your team can test which cause on the fishbone is real, using live production data.</p><p><a href="https://flowfuse.com/book-demo/">Book a Demo</a></p>]]></content>
        <updated>2026-09-17T00:00:00.000Z</updated>
        <link href="https://flowfuse.com/blog/2026/09/ishikawa-fishbone-diagram-template/"/>
        
    </entry>
    <entry>
        <id>https://flowfuse.com/blog/2026/09/capa-corrective-preventive-action/</id>
        <title>CAPA: Corrective and Preventive Action Process &amp; Effectiveness</title>
        <summary>CAPA stands for Corrective Action and Preventive Action: corrective action fixes the cause of a problem that already happened, preventive action addresses the cause of one that hasn't happened yet. Both processes depend on a real root cause investigation, not just the first plausible explanation, and neither is complete until effectiveness is verified with evidence.</summary>
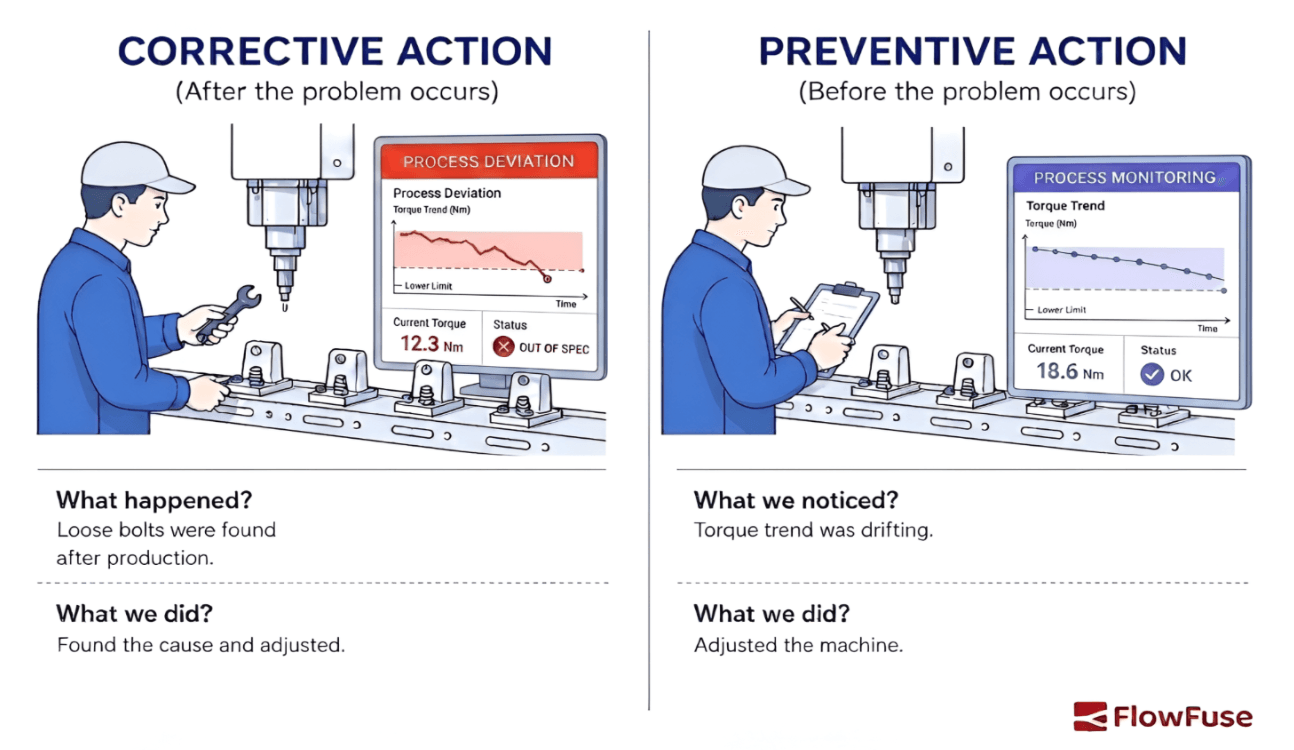
        <content type="html"><![CDATA[<p>Quality problems cost time and money, and quality teams need a structured way to address problems that have already occurred and risks that could lead to future problems. Corrective and Preventive Action (CAPA) provides that structure.</p><p>It's a core part of quality management in standards such as <a href="https://www.iso.org/standard/62085.html" rel="nofollow">ISO 9001</a> and <a href="https://www.iso.org/standard/59752.html" rel="nofollow">ISO 13485</a>, but determining whether an action actually worked can be difficult when teams rely on manually updated records. Connecting shop-floor data to quality workflows, with platforms like <a href="https://flowfuse.com/">FlowFuse</a>, can give teams objective production data to support investigations and effectiveness checks.</p><p>This article explains the difference between corrective and preventive action, how each process works, where CAPA systems break down, and how <a href="#how-flowfuse-supports-capa">FlowFuse supports CAPA</a> with connected production data.</p><a href="https://app.flowfuse.com/account/create"><img src="https://flowfuse.com/blog/2026/09/images/capa-cta-1.png" alt="Connect production data to your CAPA process - explore FlowFuse"/></a><h2 id="what-is-corrective-action-and-preventive-action">What Is Corrective Action and Preventive Action?</h2><p>Corrective action is the action taken to eliminate the cause of an existing nonconformity and prevent it from recurring.</p><p>Preventive action is the action taken to address the cause of a potential nonconformity before it occurs.</p><p>Under ISO 9001:2015, corrective action is addressed in <strong>Clause 10.2</strong>. Preventive action is no longer a standalone requirement; the 2015 revision incorporated prevention into the standard's risk-based thinking approach. Quality teams may still use preventive action as part of their risk management practices.</p><h3 id="a-simple-example">A Simple Example</h3><p>Say a machine's cutting tool wears down and starts producing parts outside tolerance. Replacing the worn tool and changing the maintenance interval to prevent the same failure from recurring is corrective action because it addresses an actual defect and its cause.</p><p><img alt="Diagram comparing corrective action, taken after a torque deviation is found out of spec, with preventive action, taken after monitoring shows torque drifting toward the lower limit" data-zoomable="" src="https://flowfuse.com/blog/2026/09/images/corrective-vs-preventive.png"/></p><p>If a technician notices during a routine check that a different tool on a similar machine is wearing faster than expected and replaces it before it produces a bad part, that's preventive action. No defect has occurred; the action addresses a potential failure.</p><p>This is the same logic behind <a href="https://flowfuse.com/blog/2025/09/preventive-maintenance-equipment-failure/">preventive maintenance programs</a> and <a href="https://flowfuse.com/blog/2025/09/poka-yoke-mistake-proofing/">poka-yoke, or mistake-proofing</a>: both aim to prevent a failure before it produces a defect.</p><p>Fixing the immediate bad parts, such as scrapping them or sorting the batch, is neither. That's <a href="https://flowfuse.com/blog/2026/08/containment-action/">containment</a>. Containment limits the immediate impact, while corrective and preventive actions address the cause.</p><h2 id="root-cause-analysis">Root Cause Analysis</h2><p>Corrective and preventive actions depend on understanding why a problem occurred or could occur. Stopping at the first plausible explanation can result in a fix that addresses the symptom while leaving the underlying cause in place.</p><p>A few methods cover most cases:</p><ul><li><strong><a href="https://flowfuse.com/blog/2025/12/five-whys-root-cause-analysis-definition-examples/">5 Whys</a>:</strong> Ask "why" repeatedly, with each answer guiding the next question, until you reach an actionable cause rather than restating the symptom.</li><li><strong><a href="https://flowfuse.com/blog/2026/07/ishikawa-fishbone-diagram/">Fishbone (Ishikawa) diagram</a>:</strong> Maps potential causes across categories such as people, methods, materials, and equipment. It's useful when a problem may have several contributing causes.</li><li><strong>Fault tree analysis:</strong> Works backward from a failure, breaking it into the combination of conditions that had to be present for it to occur. It's commonly used for complex or safety-critical processes; NASA's <a href="https://s3vi.ndc.nasa.gov/ssri-kb/static/resources/Fault%20Tree%20Handbook_NASA.pdf" rel="nofollow">Fault Tree Handbook</a> is a widely cited reference for the method.</li></ul><p>The 5 Whys and fishbone diagram are often used together; this <a href="https://flowfuse.com/blog/2026/09/5-whys-vs-fishbone-diagram/">comparison of the two</a> explains when each one fits.</p><p>The investigation should draw on multiple sources of evidence, including process records, operator interviews, maintenance logs, and inspection results. A problem can have more than one contributing cause, so addressing only one may not prevent recurrence.</p><h2 id="corrective-action-vs-preventive-action-comparison">Corrective Action vs. Preventive Action: Comparison</h2><table><thead><tr><th>Aspect</th><th>Corrective Action</th><th>Preventive Action</th></tr></thead><tbody><tr><td>Trigger</td><td>A nonconformity has occurred</td><td>A potential nonconformity is identified</td></tr><tr><td>Objective</td><td>Prevent recurrence</td><td>Prevent occurrence</td></tr><tr><td>Timing</td><td>Reactive</td><td>Proactive</td></tr><tr><td>Common inputs</td><td>Nonconformities, complaints, defects, audit findings</td><td>FMEA, risk assessments, trends, near misses</td></tr><tr><td>Common tools</td><td>5 Whys, root cause analysis</td><td>FMEA, risk assessment, trend analysis</td></tr><tr><td>Example</td><td>Investigating and fixing a failed batch</td><td>Replacing a fixture before it causes defects</td></tr></tbody></table><p>The key difference is <strong>when the action is taken</strong>: corrective action responds to an existing problem, while preventive action addresses a potential one.</p><h2 id="the-corrective-action-process">The Corrective Action Process</h2><p>A corrective action process typically follows these five steps:</p><ol><li><strong>Identify and document the nonconformance.</strong> Record what happened, when it happened, and any immediate containment taken.</li><li><strong>Investigate the cause.</strong> Use an appropriate root cause analysis method and gather enough evidence to understand why the nonconformity occurred.</li><li><strong>Determine the appropriate response.</strong> The severity and impact of the problem determine the response, which can range from changing a process to scrapping product, notifying customers, or initiating a recall.</li><li><strong>Implement the action.</strong> Address the identified cause rather than only correcting the defective output.</li><li><strong>Verify effectiveness.</strong> Monitor the relevant process or quality indicator to confirm that the action achieved its intended result before closing the CAPA.</li></ol><h2 id="the-preventive-action-process">The Preventive Action Process</h2><p>Preventive action follows a similar structure, but starts with a potential failure rather than an existing nonconformity:</p><ol><li><strong>Identify potential failure points.</strong> Use FMEA, near-miss trends, maintenance logs, or process capability data to identify where a nonconformity could occur.</li><li><strong>Assess and prioritize risk.</strong> Evaluate likelihood and severity to determine which risks require action.</li><li><strong>Implement the preventive measure.</strong> This might mean changing a maintenance schedule, modifying a process, updating work instructions, or adding mistake-proofing.</li><li><strong>Monitor the result.</strong> Track the relevant process or risk indicator to determine whether the preventive measure achieved its intended result.</li><li><strong>Document the action.</strong> Record the identified risk, action taken, and evidence that the measure was effective.</li></ol><p>Both processes can follow the <strong>Plan-Do-Check-Act (PDCA)</strong> cycle: plan and investigate, implement the action, check whether it worked, then apply what was learned.</p><h2 id="where-capa-systems-break-down">Where CAPA Systems Break Down</h2><p>A CAPA process can look complete on paper and still fail to solve the underlying problem. One common issue is that teams focus on forms and approval chains instead of collecting enough evidence during the investigation. Another is stopping at the first plausible cause and moving directly to a fix.</p><p>Even when the right action is identified, closing the CAPA without objective evidence can make it difficult to determine whether the change actually worked.</p><p>A strong CAPA process needs clear ownership, an evidence-based investigation, and a defined effectiveness check. Production data can support this. For example, <a href="https://flowfuse.com/blog/2025/07/quality-control-automation-spc-charts/">SPC charts</a> built from live process data can show whether a corrective action actually shifted a process back into control.</p><a href="https://flowfuse.com/book-demo/"><img src="https://flowfuse.com/blog/2026/09/images/capa-cta-2.png" alt="See what data-driven CAPA could look like - talk to the FlowFuse team"/></a><h2 id="how-flowfuse-supports-capa">How FlowFuse Supports CAPA</h2><p>CAPA investigations and effectiveness checks often require data from multiple systems, including machines, PLCs, databases, and quality systems. When that information is disconnected, teams may have to rely on manual records or piece together evidence from several sources.</p><p><a href="https://flowfuse.com/">FlowFuse</a> connects production systems and data sources so manufacturers can use operational data as part of their existing CAPA process.</p><p>For example, FlowFuse can help teams:</p><ul><li><strong>Collect relevant production data</strong> when a quality issue or nonconformity occurs using <a href="https://flowfuse.com/use-cases/data-integration/">data integration</a> workflows.</li><li><strong>Connect data across machines, PLCs, databases, and quality systems</strong> to support root cause investigations.</li><li><strong>Automate workflows and notifications</strong> when production or quality events require attention, including <a href="https://flowfuse.com/use-cases/production-monitoring/">production monitoring</a> and <a href="https://flowfuse.com/node-red/notification/">notifications</a>.</li><li><strong>Monitor process and quality data after an action is implemented</strong> to provide evidence for effectiveness checks, such as through <a href="https://flowfuse.com/blog/2026/08/manufacturing-dashboard-examples/#_4-quality-dashboard-defect-quality-monitoring">quality dashboards</a>.</li></ul><p>FlowFuse does not replace an organization's CAPA or quality management system. Instead, it helps connect the production data and operational workflows that support investigations, corrective actions, and verification that an action actually worked.</p><h2 id="tracking-capa-effectiveness">Tracking CAPA Effectiveness</h2><p>Closing a CAPA does not mean the problem is solved. Teams need to check whether the action actually worked.</p><p>Useful measures include CAPA cycle time, recurrence rate, overdue actions, and recurring root causes. A <a href="https://flowfuse.com/blog/2025/08/pareto-chart-manufacturing-guide/">Pareto chart</a> can help identify which causes need attention, while <a href="https://flowfuse.com/blog/2025/12/mttf-vs-mtbf-vs-mttr/">MTTF, MTBF, and MTTR</a> can help measure the effect of corrective actions on equipment reliability.</p><p>The quality of these measures depends on the data behind them. Production records, process measurements, machine states, and maintenance history can give teams the evidence they need to investigate a problem and confirm that the action was effective.</p><p><strong>See how FlowFuse works in real environments</strong></p><p>Walk through real use cases and see how teams connect systems, automate workflows, and deploy at scale.</p><p><a href="https://flowfuse.com/book-demo/">Book a Demo</a></p>]]></content>
        <updated>2026-09-08T00:00:00.000Z</updated>
        <link href="https://flowfuse.com/blog/2026/09/capa-corrective-preventive-action/"/>
        
    </entry>
    <entry>
        <id>https://flowfuse.com/blog/2026/09/first-pass-inspection-fpa/</id>
        <title>First Article Inspection (FAI): Process, Requirements &amp; Report</title>
        <summary>First Article Inspection (FAI) verifies that a newly manufactured part meets its engineering requirements. Learn when FAI is required, how the process works, what an FAI report includes, and how it differs from PPAP.</summary>
        <content type="html"><![CDATA[<p>Before full-scale production, <a href="https://flowfuse.com/industries/automotive/">automotive manufacturers</a> need to verify that a part can be produced according to its engineering requirements. First Article Inspection (FAI) provides documented evidence that a part produced using the intended manufacturing process conforms to its engineering drawing, specifications, and other applicable requirements.</p><p>Much of this still runs on paper checklists and spreadsheets, which makes it easy for inspection results to drift away from the production data that explains them.</p><a href="https://app.flowfuse.com/account/create"><img src="https://flowfuse.com/blog/2026/09/images/fai-process-cta1.png" alt="Use FlowFuse to connect production data, build digital inspection workflows, and get better visibility into your quality processes - start your free trial"/></a><h2 id="what-is-first-article-inspection-fai">What Is First Article Inspection (FAI)?</h2><p>First Article Inspection (FAI) is a planned, complete, independent, and documented physical and functional inspection process used to verify that production processes can produce an item that meets specified requirements.</p><p>That definition comes from <a href="https://saemobilus.sae.org/standards/as9102c-aerospace-series-first-article-inspection-requirements" rel="nofollow">SAE AS9102</a>, the standard that establishes the requirements for performing and documenting FAI. AS9102 originated in aerospace, but its terminology and report structure now shape how many customers outside aerospace, including automotive customers, define FAI in their own purchase documents.</p><p>Inspectors check dimensions, tolerances, materials, surface finishes, and other specified characteristics against the engineering drawing, specifications, and applicable requirements.</p><p>The goal is to confirm that the manufacturing process can produce a part that meets the defined requirements before or during production approval.</p><h2 id="fai-example-inspecting-an-automotive-part">FAI Example: Inspecting an Automotive Part</h2><p>Consider a supplier manufacturing a machined mounting bracket. Its drawing specifies:</p><table><thead><tr><th>Characteristic</th><th>Requirement</th><th>Actual Result</th><th>Status</th></tr></thead><tbody><tr><td>Overall length</td><td>120 ± 0.5 mm</td><td>120.2 mm</td><td>Pass</td></tr><tr><td>Hole diameter</td><td>10 ± 0.1 mm</td><td>10.04 mm</td><td>Pass</td></tr><tr><td>Hole position</td><td>±0.2 mm</td><td>0.15 mm</td><td>Pass</td></tr><tr><td>Material</td><td>Specified alloy</td><td>Verified</td><td>Pass</td></tr></tbody></table><p>If the hole position measured 0.35 mm against a ±0.2 mm requirement, it would fail. The supplier would document the nonconformance, determine the cause, take the required corrective action, and reinspect the affected characteristic.</p><h2 id="when-is-fai-required">When Is FAI Required?</h2><p>FAI requirements vary by customer, industry, and quality procedures. It is typically performed when a new part or a change could affect the part's requirements.</p><p>In automotive, the specifics usually come from the customer rather than from a single industry-wide FAI standard. IATF 16949 requires suppliers to run a product and manufacturing process approval process that conforms to requirements the customer defines, and each OEM publishes its own <a href="https://www.iatfglobaloversight.org/oem-requirements/customer-specific-requirements/" rel="nofollow">customer-specific requirements</a> through the IATF. Check the applicable purchase document and customer-specific requirements before deciding what to inspect and submit.</p><p>Common triggers include:</p><ul><li>New part introduction</li><li>Significant design or engineering changes</li><li>New tooling or equipment</li><li>Manufacturing process changes</li><li>New manufacturing location or supplier</li><li>Production restart after a significant interruption</li></ul><p>Depending on the applicable requirements, a change may require a <strong>full or partial FAI</strong>. A partial FAI focuses on the characteristics affected by the change rather than repeating the entire inspection.</p><h2 id="how-does-the-fai-process-work">How Does the FAI Process Work?</h2><p><img alt="FAI process flow: requirements, produce, inspect, record, correct, and traceability, with nonconformance looping back from correct to inspect before production approval" data-zoomable="" src="https://flowfuse.com/blog/2026/09/images/fai-flow.png"/></p><h3 id="_1-review-the-requirements">1. Review the requirements</h3><p>Use the latest engineering drawing, specifications, and revision. Identify the characteristics that require inspection and any applicable customer requirements.</p><h3 id="_2-produce-the-first-article">2. Produce the first article</h3><p>Manufacture the part using the intended materials, tooling, equipment, and production process. The objective is to inspect a part representative of the manufacturing process being evaluated.</p><h3 id="_3-inspect-the-part">3. Inspect the part</h3><p>Measure the required characteristics using appropriate inspection equipment. Compare each result with the specified requirement and acceptance criteria.</p><h3 id="_4-record-the-results">4. Record the results</h3><p>Document the requirements, measurements, inspection equipment, and other required information in the FAI report.</p><h3 id="_5-address-failures">5. Address failures</h3><p>If a characteristic does not conform, document the nonconformance, determine the cause and required corrective action, and reinspect the affected characteristic after correction.</p><h3 id="_6-maintain-traceability">6. Maintain traceability</h3><p>Maintain records that connect the inspection results to the part, drawing revision, production run, tooling, equipment, and measurement equipment where required. This is the same <a href="https://flowfuse.com/blog/2026/08/automotive-traceability/">traceability</a> backbone that makes it easier to determine what was inspected and investigate issues later.</p><h2 id="what-does-an-fai-report-include">What Does an FAI Report Include?</h2><p>An FAI report documents the requirements that were inspected and the results obtained. Depending on the applicable requirements, it may include:</p><ul><li>Part number and name</li><li>Drawing number and revision</li><li>Characteristic or feature identification</li><li>Nominal dimensions and tolerances</li><li>Actual measurement results</li><li>Material and process information</li><li>Inspection and measurement equipment</li><li>Inspection date and personnel</li><li>Nonconformities and disposition</li><li>Supporting documentation and traceability information</li></ul><p>For example, a dimensional characteristic might be recorded with its drawing requirement, actual measurement, inspection method or equipment, and pass/fail result. This creates a traceable record showing whether the inspected part met the specified requirements.</p><p>The exact contents and format of an FAI report depend on the applicable customer, industry, and quality requirements. Customers that work to AS9102 expect the results on its three standard forms: part number accountability, product accountability for material and special processes, and the characteristic-level results.</p><h2 id="fai-vs-ppap">FAI vs. PPAP</h2><p>FAI and <a href="https://flowfuse.com/blog/2026/09/ppap/">Production Part Approval Process (PPAP)</a> both help verify that manufactured parts meet requirements, but they serve different purposes. PPAP is defined in the <a href="https://www.aiag.org/training-and-resources/manuals" rel="nofollow">PPAP manual published by AIAG</a>, and most North American OEMs name that manual directly in their customer-specific requirements.</p><table><thead><tr><th></th><th>FAI</th><th>PPAP</th></tr></thead><tbody><tr><td>Main focus</td><td>Verifying a part against its engineering requirements</td><td>Demonstrating that the production process can consistently produce conforming parts</td></tr><tr><td>Dimensional inspection</td><td>Yes</td><td>Typically included</td></tr><tr><td>Material/process records</td><td>May be included</td><td>May be required</td></tr><tr><td><a href="https://flowfuse.com/blog/2026/08/control-plans/">Control Plan</a></td><td>Not inherently part of FAI</td><td>Common PPAP element</td></tr><tr><td>PFMEA</td><td>Not inherently part of FAI</td><td>Common PPAP element</td></tr><tr><td>Process capability</td><td>Not the main focus</td><td>May be required</td></tr><tr><td>Measurement system analysis</td><td>May be applicable</td><td>May be required</td></tr></tbody></table><p>FAI primarily demonstrates that the inspected part conforms to the defined design requirements. PPAP provides broader evidence that the supplier's production process and supporting quality systems are capable of consistently producing conforming parts. AIAG publishes the supporting core tool manuals, including MSA and SPC, that PPAP submissions draw on.</p><p>FAI can support a PPAP submission, but it does not replace PPAP when a customer requires it. PPAP approval also isn't the end of the story — most OEMs require a <a href="https://flowfuse.com/blog/2026/08/safe-launch/">safe launch</a> monitoring period once production starts.</p><h2 id="common-first-article-inspection-mistakes">Common First Article Inspection Mistakes</h2><p>Common FAI errors include using an outdated drawing or specification, <a href="https://flowfuse.com/blog/2026/07/what-is-instrument-calibration/">uncalibrated inspection equipment</a>, inspecting a part made with the wrong production process, missing characteristics, and incomplete measurement records.</p><p>Calibration is where inspection records most often lose their weight. Calibration by a laboratory accredited to <a href="https://www.iso.org/standard/66912.html" rel="nofollow">ISO/IEC 17025</a> ties a measurement result back to recognized measurement standards through a documented chain, which is what makes the number on the FAI report defensible during a customer review or an investigation.</p><p>Using the correct drawing revision, appropriate and calibrated inspection equipment, the intended production process, and traceable inspection records helps avoid these errors. Tracking calibration status against due dates in a <a href="https://flowfuse.com/blog/2026/07/calibration-management-dashboard/">live dashboard</a> makes it easier to catch an overdue instrument before it ends up on an FAI report.</p><a href="https://app.flowfuse.com/account/create"><img src="https://flowfuse.com/blog/2026/09/images/fai-cta2.png" alt="Use FlowFuse to connect your equipment data, track calibration status and due dates, and build a dashboard around your calibration workflow - build a calibration dashboard"/></a><h2 id="improving-first-article-inspection-with-digital-data">Improving First Article Inspection With Digital Data</h2><p>Traditional FAI can rely on inspection sheets, spreadsheets, and manual data entry. This can leave inspection results disconnected from the production data associated with the part.</p><p><a href="https://flowfuse.com/">FlowFuse</a> connects machines, inspection systems, databases, and other factory systems so manufacturers can collect and process data in one workflow.</p><p>For example, an FAI workflow can associate inspection results with a part, machine, production run, tooling, material batch, or work order. If a hole diameter repeatedly approaches its tolerance, manufacturers can compare inspection results with machine and production data to investigate whether tooling, equipment, material, or a specific production run is contributing to the issue.</p><p>FlowFuse does not replace the FAI process. It connects the production data around it, reducing manual data handling and making inspection results easier to use for <a href="https://flowfuse.com/blog/2026/07/defect-and-quality-monitoring/">quality analysis and investigation</a>.</p><p><strong>Connect First Article Inspection Data with FlowFuse</strong></p><p>Connect inspection results with machine and production data using FlowFuse to reduce manual data handling and investigate quality issues.</p><p><a href="https://flowfuse.com/contact-us/">Contact Us</a></p>]]></content>
        <updated>2026-09-08T00:00:00.000Z</updated>
        <link href="https://flowfuse.com/blog/2026/09/first-pass-inspection-fpa/"/>
        
    </entry>
    <entry>
        <id>https://flowfuse.com/blog/2026/09/industrial-ai-agent/</id>
        <title>Connect Your Industrial AI Agent to FlowFuse</title>
        <summary>FlowFuse 3.0 acts as an MCP server, so the AI agent your company already approved can operate FlowFuse and build flows in your Node-RED instances. You add one address, sign in, and choose which teams the agent reaches and whether it gets editing rights. It manages the FlowFuse platform and builds flows on a Node-RED canvas you are watching. It cannot delete anything, so you remain in control of deploying your flows. For teams under approved-AI-only policy, this is the difference between no AI on the platform and all of it.</summary>
        <content type="html"><![CDATA[<p>What used to happen is that an engineer would open their AI agent of choice in another tab or application, describe what they would need to happen in Node-RED, they get the JSON back, then copy, paste, and import that into the editor. Doing so, on repeat, until it is right. The AI is already doing the work, just not in an efficient way that requires you to be a part of it.</p><p>That's not how an industrial AI agent should work. It should be able to work directly with your industrial systems, rather than generating something for you to copy and paste.</p><p>That's what our first class integrated industrial AI agent, FlowFuse Expert, was built to do. It works within the FlowFuse platform, where it can understand your applications, instances, flows, and operational data, and then build and edit the operational flows directly in Node-RED instances.</p><table><thead><tr><th align="left"></th><th align="left"><strong>Without FlowFuse Expert</strong></th><th align="left"><strong>With FlowFuse Expert</strong></th></tr></thead><tbody><tr><td align="left"><strong>Creating and editing Node-RED flows</strong></td><td align="left">Wiring flows by hand or asking an external AI for JSON to be copy and pasted over, including errors.</td><td align="left">The industrial AI agent creates or edits the flows right in front of you.</td></tr><tr><td align="left"><strong>Setting up an industrial application</strong></td><td align="left">Manually setting up FlowFuse applications, instances, and connecting them together through submodules or pipelines so it's ready for a production setup, plus configuring the flows.</td><td align="left">The industrial AI agent helps you set it up from start to finish. You can even plan with the AI agent so you are sure it aligns with your expectations. The AI will help you ensure it will be ready for a production setup.</td></tr><tr><td align="left"><strong>Asking about your industrial fleet</strong></td><td align="left">Manually walking through the platform UI to figure out what runs how.</td><td align="left">The industrial AI agent scans your FlowFuse instance and understands what there is and its status, then reports it to you in natural language.</td></tr><tr><td align="left"><strong>Asking about your operational data</strong></td><td align="left">Manually configuring the data aggregation, modeling, and visualisation into dashboards, then monitoring those.</td><td align="left">The industrial AI agent configures the data aggregation, modeling, and visualisation for you into a usable dashboard. And it can also create custom MCP servers which allow you to ask about your operational data in natural language.</td></tr></tbody></table><h2 id="so-why-did-this-happen">So why did this happen?</h2><p>Ask why they don't use the FlowFuse Expert built into the platform, and the answer usually isn't about quality; it's about policy. Plenty of the companies we work with run an approved-AI-only rule. So for those teams the only option was to use "their AI, through the clipboard" with the alternative being no AI-support at all.</p><h2 id="what-changed-in-flowfuse-30">What changed in FlowFuse 3.0</h2><p>FlowFuse now acts as an MCP server. Your own AI agent connects to it as a client and because the AI agent is yours, so is the choice of model it uses.</p><p>That means the AI agent your company already approved can work the platform directly: look at your teams and applications, check what your instances are doing, read runtime logs, query your <a href="https://flowfuse.com/docs/flowfuse-nodes/flowfuse-tables/">FlowFuse Tables</a> data, create applications and instances, and build and edit the flows inside your instances.</p><h2 id="how-an-ai-agent-connects-to-flowfuse">How an AI agent connects to FlowFuse</h2><p>Connecting an AI agent to FlowFuse takes three steps depending on the agent you would like to use.</p><p>You add one address in your AI agent's connector settings. On FlowFuse Cloud that address is <code>https://app.flowfuse.com/mcp</code>. You are then triggered to sign in to FlowFuse, after which you pick which teams the AI agent may act on, and whether it gets editing rights or read access only.</p><p>If you want to jump ahead and get connected now, <a href="#connect-your-own-agent">skip to the steps at the end</a>.</p><h2 id="what-youre-actually-granting">What you're actually granting</h2><p>"We gave an AI agent access to production" is usually a sentence that ends conversations, so let's clarify.</p><p>You choose the teams. If you have a production team and a development team, granting only development means an instruction can only hit what you manage in that team.</p><p>You choose read access or editing rights. Read access is useful on its own: what's running, what's failing, what the logs say, what's in your tables, and so on. An industrial AI agent with read access has no ability to change anything. When permitting editing rights, the agent can set up applications, instances, and edit the flows inside of them.</p><p>And there are things nobody can grant. An industrial AI agent working through FlowFuse can't delete an instance, an application, a snapshot, or a team. That is because those tools don't exist. Lastly, deploying a Node-RED flow is, for now, still done by you manually as well.</p><p>Two things run underneath all of it. The role-based access control that already governs your teams affects the industrial agent too, so it can't reach past what your own account reaches. And every action it takes lands in the audit log attributed to you and marked <code>via MCP</code>, so "what the AI did last Tuesday" is a question with an answer.</p><p>Most agents will prompt you and ask before they act. This logic belongs to the agent itself rather than to FlowFuse, so it looks different in each one, but in practice you see the tool call before it runs, so you retain visibility and control.</p><p>We're working towards AI that can act as required in production setups and in setups where experimentation is fine, and those are different settings for different scenarios. But what is described above is the boundary as it ships right now.</p><h2 id="it-builds-where-you-can-see-it">It builds where you can see it</h2><p>Node-RED has always been visual. You look at a flow and you can tell what it does.</p><p>We didn't want to trade away control for AI, so when your agent builds a flow, it builds it in a live editor session, on the canvas in front of you. You watch the nodes appear and get wired up. If it's going somewhere you don't like, you can see that while it's happening rather than afterwards. Up for review before you enable the deployment.</p><p>Asking questions about your platform needs no active browser session open at all. It's flow work specifically that runs in an editor you're looking at.</p><h2 id="the-conversation-with-it">The conversation with IT</h2><p>Most people reading this can't add a connector on their company sanctioned AI agent. On ChatGPT, a workspace administrator switches on custom connectors. On Claude Team and Enterprise, an owner adds the connector for the organisation and then people connect individually. On Microsoft Copilot, a tenant administrator approves it.</p><p>It's one address. Everyone still signs in with their own FlowFuse account, and still chooses their own scopes, so nobody inherits anyone else's access. Nothing about it makes FlowFuse a new data processor for your organisation.</p><p>We're also working on removing the question at all.</p><note><p><strong>Coming soon:</strong> FlowFuse in the Microsoft Copilot, Claude and ChatGPT connector directories. No custom connector, no admin request. FlowFuse Cloud only.</p></note><h2 id="where-to-start">Where to start</h2><p>If your team is on FlowFuse Cloud, you can get connected already. Our <a href="https://flowfuse.com/ai/">Industrial AI page</a> has the three steps for whichever agent you use similar as noted above.</p><p>If your team is on FlowFuse self-hosted, make sure to be on at least version FlowFuse 3.0 or higher. On self-hosted, platform messaging runs over the MQTT broker, so the Team Broker needs to be available. Whether anything is needed from you depends on how your self-hosted platform was installed. <a href="https://flowfuse.com/docs/user/expert/third-party-agents/">Our documentation</a> has further details on what to do for custom situations.</p><p>For now, begin with any of the following prompts when authenticated with the platform:</p><h2 id="connect-your-own-agent">Connect your own agent</h2><p>Three steps, and they depend on which agent you would like to use.</p><p><strong>Want to see this against your own setup?</strong></p><p>Walk through connecting your agent with our team, on your instances, and see what it can and cannot reach.</p><p><a href="https://flowfuse.com/book-demo/">Book a Demo</a></p>]]></content>
        <updated>2026-09-03T00:00:00.000Z</updated>
        <link href="https://flowfuse.com/blog/2026/09/industrial-ai-agent/"/>
        
    </entry>
    <entry>
        <id>https://flowfuse.com/blog/2026/09/layered-process-audit-checklist-template/</id>
        <title>Layered Process Audit Checklist: Free Template and Examples</title>
        <summary>A layered process audit (LPA) checklist helps manufacturers consistently verify critical process controls. Learn what to include, how to write effective LPA questions, and download a free checklist template.</summary>
        <content type="html"><![CDATA[<p>A <a href="https://flowfuse.com/blog/2026/08/layered-process-audit/">Layered Process Audit (LPA)</a> checklist gives supervisors and managers a consistent way to verify critical process controls on the shop floor.</p><p>A good checklist is focused rather than comprehensive. It should cover the controls that matter most to the process and use questions that can be answered by observing the work.</p><p><em>If you're building an LPA program, having a consistent set of questions makes it easier for different management layers to audit the same critical controls. Download the free checklist below as a starting point for creating your own LPA.</em></p><h2 id="what-should-be-on-an-lpa-checklist">What Should Be on an LPA Checklist?</h2><p>LPA questions should come from the controls that are important to the process. Useful sources include the PFMEA, control plan, work instructions, previous audit findings, customer complaints, and recurring scrap or rework.</p><p>Depending on the process, a checklist might cover:</p><ul><li><strong>Standard work:</strong> Is the current work instruction being used?</li><li><strong>Materials:</strong> Is the correct material being used at the station?</li><li><strong>Equipment:</strong> Is the machine parameter within the approved range?</li><li><strong>Tooling:</strong> Is the torque tool within its required calibration period?</li><li><strong>Error-proofing:</strong> Is the poka-yoke device active?</li><li><strong>Traceability:</strong> Is the required batch or serial number recorded?</li></ul><p>Not every checklist needs all of these areas. Select the controls that are most relevant to the process being audited.</p><h2 id="how-to-write-lpa-questions">How to Write LPA Questions</h2><p>Questions should be specific enough that the auditor knows exactly what to check.</p><table><thead><tr><th>Avoid</th><th>Better</th></tr></thead><tbody><tr><td>Are the tools OK?</td><td>Is the torque tool within its required calibration period?</td></tr><tr><td>Is the operator following the process?</td><td>Is the operator following the defined assembly sequence?</td></tr><tr><td>Is quality being maintained?</td><td>Is the approved work instruction being used?</td></tr></tbody></table><p>The goal is to make each question <strong>objective and observable</strong>, rather than dependent on the auditor's opinion.</p><h2 id="lpa-checklist-example">LPA Checklist Example</h2><p>Consider an automotive assembly station where a component is fastened using a torque-controlled tool.</p><p>The checklist might verify that the current work instruction is being used, the correct component is at the station, the torque tool is within its approved range, and the error-proofing system is active.</p><p>During the audit, the supervisor finds the torque setting outside the approved range. They correct the setting, record the finding, and check what the station has built since the last verified check. Anything suspect gets segregated before it moves down the line.</p><p>A later audit verifies the setting held.</p><p>The checklist makes these critical controls easy to verify consistently without turning the LPA into a full process audit.</p><h2 id="keep-the-checklist-relevant">Keep the Checklist Relevant</h2><p>A checklist should change when the process or its risks change.</p><p>Review it after significant process changes, recurring quality problems, new customer requirements, or findings that show the current questions are no longer sufficient.</p><p>Avoid adding questions simply to make the checklist more comprehensive. The goal is to check the controls that matter, not everything that could possibly be checked.</p><p><strong>Build a Digital LPA with FlowFuse</strong></p><p>Use FlowFuse to build digital LPA forms, connect audit results to machine and production data, trigger alerts, and track corrective actions.</p><p><a href="https://flowfuse.com/contact-us/">Contact Us</a></p>]]></content>
        <updated>2026-09-03T00:00:00.000Z</updated>
        <link href="https://flowfuse.com/blog/2026/09/layered-process-audit-checklist-template/"/>
        
    </entry>
    <entry>
        <id>https://flowfuse.com/blog/2026/08/vda-6.3/</id>
        <title>VDA 6.3 Process Audits Explained: Structure, Scoring, and How to Prepare</title>
        <summary>VDA 6.3 evaluates whether processes are planned, controlled, and capable of producing conforming output. The audit covers seven process elements, from potential analysis and project management to production and customer service. Strong audit preparation depends on consistent documentation, production data, process controls, and objective evidence.</summary>
        <content type="html"><![CDATA[<p>VDA 6.3 audits assess whether automotive processes are consistently controlled and capable of meeting requirements. For suppliers, the challenge is not just following procedures but being able to demonstrate how processes perform with reliable evidence.</p><p>That evidence is often spread across machines, <a href="https://flowfuse.com/landing/plc/">PLCs</a>, sensors, <a href="https://flowfuse.com/use-cases/mes/">MES platforms</a>, and quality systems. FlowFuse can connect these production systems and bring operational data together, making it easier to access the evidence needed to monitor and demonstrate process performance.</p><p>This guide covers VDA 6.3 process elements, scoring, audit evidence, common findings, and how to prepare.</p><a href="https://flowfuse.com/book-demo/"><img src="https://flowfuse.com/blog/2026/08/images/vda-6-3.cta.png" alt="make process data easier to access during audits - book a demo"/></a><h2 id="what-vda-63-audits">What VDA 6.3 audits</h2><p>VDA 6.3 was developed by the Verband der Automobilindustrie (VDA) to evaluate process performance across the product and process lifecycle. The <a href="https://vda-qmc.de/en/education/vda-6-3-process-audit-at-a-glance-id-380/" rel="nofollow">VDA QMC</a> describes it as a reference manual for conducting process audits across the automotive supply chain.</p><p>VDA 6.3 is different from <a href="https://www.iatfglobaloversight.org/" rel="nofollow">IATF 16949</a>. IATF 16949 focuses on the automotive quality management system, while VDA 6.3 examines whether a specific process is planned, controlled, and capable of producing the required output. VDA 6.5, by comparison, focuses on the product itself.</p><p>Auditors review documented procedures, inspect the production floor, question process owners, and compare records with actual conditions. Having IATF 16949 certification does not guarantee a strong VDA 6.3 result.</p><h2 id="when-is-vda-63-used">When is VDA 6.3 used?</h2><p>VDA 6.3 can be used at different stages of the supplier and production lifecycle. A potential supplier may be assessed before a contract is awarded, while established suppliers may be audited during product development or series production.</p><p>Process audits can also be triggered by major process changes, recurring quality problems, or customer requirements. The scope depends on the purpose of the audit, so an audit does not necessarily cover every process element from P1 to P7.</p><h2 id="the-seven-process-elements">The seven process elements</h2><p>VDA 6.3 divides the audit into seven process elements:</p><table><thead><tr><th>Element</th><th>Name</th><th>What it covers</th></tr></thead><tbody><tr><td>P1</td><td>Potential Analysis</td><td>Capability of a prospective supplier before awarding work</td></tr><tr><td>P2</td><td>Project Management</td><td>Planning, scheduling, and control of development projects</td></tr><tr><td>P3</td><td>Planning of Product and Process Development</td><td>Requirements, feasibility, and risk analysis</td></tr><tr><td>P4</td><td>Carrying Out Product and Process Development</td><td>Development, FMEA, validation, and release</td></tr><tr><td>P5</td><td>Supplier Management</td><td>Selection, evaluation, and monitoring of sub-suppliers</td></tr><tr><td>P6</td><td>Process Analysis / Production</td><td>Production inputs, controls, resources, and outputs</td></tr><tr><td>P7</td><td>Customer Care / Customer Satisfaction / Service</td><td>Complaints, field performance, and corrective actions</td></tr></tbody></table><p>P1 is generally used when assessing a potential supplier or new location and is not scored with P2–P7. For established production, the audit typically covers P2–P7.</p><p>P6 focuses on the production process and examines six areas: process inputs, work carried out, personnel resources, material resources, effectiveness, and process outputs. These areas cover everything from incoming materials and process instructions to operator qualifications, equipment, process controls, and the quality of the finished output.</p><h2 id="how-a-vda-63-audit-works">How a VDA 6.3 audit works</h2><p>A VDA 6.3 audit starts with preparation and definition of the audit scope. The auditor reviews relevant information and identifies the processes and personnel to be assessed.</p><p>Before the audit, potential process risks should be identified so they can be assessed during the audit. VDA 6.3 uses the <strong>Turtle Model</strong> as one way to structure this risk analysis. It examines what enters and leaves the process, how the work is performed, which personnel and resources support it, and how process effectiveness is measured. The model can be applied to different process elements, including P6.</p><p><img alt="Turtle diagram for VDA 6.3 process audits, showing a central process surrounded by six questions covering input, output, resources used, personnel involved, and process results" src="https://flowfuse.com/blog/2026/08/images/turtle-diagrm.png"/><em>Turtle diagram for VDA 6.3 process audits, showing a central process surrounded by six questions covering input, output, resources used, personnel involved, and process results</em></p><p>During the audit, the auditor examines documents, observes the process, asks employees questions, and reviews objective evidence. Findings are recorded and the applicable questions are scored.</p><p>The audit ends with a closing meeting where the results and identified weaknesses are discussed. Corrective actions may then be assigned, followed by a review of whether those actions have addressed the findings.</p><h2 id="how-vda-63-scoring-works">How VDA 6.3 scoring works</h2><p>Audit questions are scored according to how well the requirement is met:</p><table><thead><tr><th>Score</th><th>Meaning</th></tr></thead><tbody><tr><td>10</td><td>Requirement fully met</td></tr><tr><td>8</td><td>Requirement largely met</td></tr><tr><td>6</td><td>Requirement partially met</td></tr><tr><td>4</td><td>Requirement inadequately met</td></tr><tr><td>0</td><td>Requirement not met</td></tr></tbody></table><p>The auditor bases the score on objective evidence from the process. Individual question scores are then used to calculate the result for the relevant process elements and the overall audit.</p><p>The classification is:</p><ul><li><strong>A:</strong> 90% or higher — capable</li><li><strong>B:</strong> 80–89% — conditionally capable</li><li><strong>C:</strong> Below 80% — not capable</li></ul><p>Specific downgrade rules can also affect the classification when serious weaknesses are identified. The overall percentage should therefore not be considered in isolation. The A/B/C classification and 10-8-6-4-0 scoring model remain part of VDA 6.3:2023.</p><h2 id="what-auditors-look-for">What auditors look for</h2><p>Auditors compare documented requirements with what is happening on the production floor.</p><p>They may check control plans against the current process, FMEA and <a href="https://flowfuse.com/blog/2026/08/control-plans">control plan</a> linkage, <a href="https://flowfuse.com/blog/2026/08/statistical-process-control">SPC</a> data and capability values such as Cp and Cpk, reaction plans for out-of-control conditions, operator training records, corrective actions and their effectiveness, and production and inspection records. Much of this, including the PFMEA, control plan, measurement system analysis, and capability studies, first appears in the supplier's <a href="https://flowfuse.com/blog/2026/09/ppap/">PPAP</a> submission, so auditors often check whether the process still matches what was approved.</p><p>The main risk is a gap between documentation and actual production. When production data is spread across different machines and systems, it can be difficult to connect that data back to the documented process and demonstrate that the required controls were followed.</p><p>For example, a control plan may identify a bore diameter as a critical characteristic, while the measurement system stores that value under a different name with different limits. If the systems are not connected, proving that the characteristic was checked correctly can require manual data matching.</p><p>By connecting these systems, FlowFuse can help make the production data behind these checks easier to access and trace.</p><h2 id="common-reasons-suppliers-lose-points">Common reasons suppliers lose points</h2><p>Common findings include outdated control plans after process changes, missing links between FMEAs and control plans, capability values below requirements without an effective reaction plan, weak oversight of sub-suppliers, corrective actions closed without effectiveness evidence, training records that do not match the current process, and production data that cannot be traced to the relevant characteristic or operation.</p><p>These issues often develop when process changes are not reflected across documents, systems, and training records.</p><p><a href="https://flowfuse.com/blog/2026/08/layered-process-audit">Layered process audits</a> can help identify these gaps between formal VDA 6.3 audits. Short, regular checks on the production floor can catch bypassed controls, outdated work instructions, and missing records earlier.</p><h2 id="how-to-prepare-for-a-vda-63-audit">How to prepare for a VDA 6.3 audit</h2><p>Run an internal audit against the applicable VDA 6.3 requirements before the external audit. Focus on evidence from the current production process.</p><ol><li><strong>Check process documentation.</strong> Make sure control plans, <a href="https://flowfuse.com/blog/2026/07/digital-work-instruction">work instructions</a>, and FMEAs match the current process.</li><li><strong>Review production data.</strong> Check SPC charts, capability values, inspection records, and deviation logs. Make sure the data can be retrieved quickly.</li><li><strong>Check the production floor.</strong> Verify that equipment, materials, process parameters, identification, and controls match the documented process.</li><li><strong>Review corrective actions.</strong> Confirm that open and recently closed actions include evidence that the corrective action was effective.</li><li><strong>Prepare process owners and operators.</strong> Make sure the people involved can explain their processes and understand the controls that apply to their work.</li></ol><p>The best preparation is to keep process documentation, production data, training, and corrective actions aligned throughout the year rather than preparing only before the audit.</p><p><strong>Connect your production data with FlowFuse</strong></p><p>Bring data from machines, PLCs, and industrial systems into one place to make process information easier to access and monitor.</p><p><a href="https://flowfuse.com/book-demo/">Book a Demo</a></p>]]></content>
        <updated>2026-08-31T00:00:00.000Z</updated>
        <link href="https://flowfuse.com/blog/2026/08/vda-6.3/"/>
        
    </entry>
    <entry>
        <id>https://flowfuse.com/blog/2026/08/control-plans/</id>
        <title>Control Plans: Linking Quality Characteristics to Measurement Data</title>
        <summary>Control plans specify what to measure, how often, and how to react, but this logic is rarely connected to the equipment collecting data on the floor, creating gaps in identifiers, limits, inspection frequency, and reaction plans. Closing the gap requires mapping characteristics to measurement points, capturing production context with each reading, maintaining a single source of truth for limits, and triggering reactions automatically when measurements fall out of spec.</summary>
        <content type="html"><![CDATA[<p>A control plan requires a bore diameter check on every part, within a defined tolerance, with a reaction if it falls outside. The gauge records the measurement under its own point ID; the CMM uses another. Neither is directly linked to the control plan.</p><p>That makes compliance a manual exercise: match measurements to control plan requirements, check inspection coverage, verify limits, and confirm reactions.</p><p>The solution is to connect control plan characteristics to production measurements so each reading can be evaluated against the right requirement as it happens. That only works when the measurement data itself is trustworthy, including <a href="https://flowfuse.com/blog/2026/07/calibration-management-dashboard/">calibration status</a>.</p><a href="https://app.flowfuse.com/account/create"><img src="https://flowfuse.com/blog/2026/08/images/control-plan-cta-1.png" alt="Know which gauges are due for calibration - sign up for FlowFuse"/></a><h2 id="what-a-control-plan-specifies">What a control plan specifies</h2><p>A control plan is a structured document that defines what needs to be controlled during production, how it should be measured, how often it should be checked, and what to do when a result is out of specification. It is typically developed as part of <a href="https://www.aiag.org/training-and-resources/manuals/details/APQP-3" rel="nofollow">APQP</a> and maintained within an <a href="https://www.iatfglobaloversight.org/iatf-169492016/" rel="nofollow">IATF 16949</a> quality system. It is also one of the 18 elements of a <a href="https://flowfuse.com/blog/2026/09/ppap/">PPAP</a> submission, where it shows the customer how the part will be controlled once production starts.</p><p>For each process step, it defines:</p><ul><li><strong>Characteristic:</strong> the dimension, torque, weld strength, surface finish, or other property being controlled</li><li><strong>Specification:</strong> the required value and acceptable tolerance</li><li><strong>Measurement method:</strong> the equipment or method used to check it</li><li><strong>Inspection frequency:</strong> how often the check must be performed</li><li><strong>Reaction plan:</strong> what happens when a result is outside the specified limits</li><li><strong>Special characteristic:</strong> whether the characteristic has additional control requirements</li></ul><p>For example, a row might specify: bore diameter at Station 30, 25.00 mm ± 0.05 mm, measured with an in-line air gauge on every part, with CMM verification every 50 parts. An out-of-spec result requires the part to be rejected and the quality engineer notified.</p><h2 id="where-the-link-breaks-down">Where the link breaks down</h2><p>Control plans get created before production starts, then reviewed and updated as the process changes. That part usually works. What doesn't is the equipment on the floor, which carries on with whatever was configured at installation. Gauges, CMMs, torque controllers, vision systems, and <a href="https://flowfuse.com/blog/2025/12/what-is-plc/">PLCs</a> collect measurements without knowing what the control plan requires.</p><h3 id="identifiers-dont-match">Identifiers don't match</h3><p>A control plan might call something "Bore Diameter, Station 30," while the CMM stores it as <code>DIM_30_04</code> and the in-line gauge reports it as channel 4. Without a stable mapping between them, no system can confirm they're referring to the same characteristic. That mapping has to be built device by device, then maintained as equipment is added, replaced, or reconfigured.</p><h3 id="measurements-arrive-without-context">Measurements arrive without context</h3><p>A torque reading of 42.1 Nm only becomes useful for <a href="https://flowfuse.com/blog/2026/08/automotive-traceability/">traceability</a> once it's tied to the part, the workstation, a timestamp, the operator, and the device. Capturing that context at the moment of measurement avoids reconstructing it later, a reconstruction that isn't always possible.</p><h3 id="limits-drift-apart">Limits drift apart</h3><p>The control plan might specify 24.95 to 25.05 mm for the Station 30 bore while the in-line gauge enforces 24.94 to 25.06 mm. Both systems work fine; they just enforce different requirements, and a change to one can go unnoticed for a long time. The fix is a single source of truth for <a href="https://flowfuse.com/blog/2025/11/industrial-data-validation-guide/">limits and validation</a>, with a controlled path for pushing changes to equipment and a record of which limits were active when each part was produced. On validated processes, that path may itself need to go through change control.</p><h3 id="reactions-stay-manual">Reactions stay manual</h3><p>The control plan may require a failed part to be rejected, held, and reported, but the measurement device just records the value. Someone still has to catch it and act. Closing this gap means triggering the reaction at the moment of measurement: the part held, the right person notified, the event logged automatically.</p><p>Inspection frequency compounds all four. A control plan may require 100% inspection, but a measurement system just collects whatever gets recorded. The presence of data doesn't prove the required frequency was followed. Solving the four gaps above is what makes frequency verifiable in the first place: a mapped, contextualized measurement stream is what lets you confirm every required check actually happened.</p><a href="https://flowfuse.com/book-demo/"><img src="https://flowfuse.com/blog/2026/08/images/control-plan-cta-2.png" alt="Not sure where your measurement data gaps are? Book a demo"/></a><h2 id="a-practical-example">A practical example</h2><p>Consider a fastener torque check with the following requirements:</p><ul><li><strong>Specification:</strong> 40 to 45 Nm</li><li><strong>Inspection:</strong> 100%</li><li><strong>Reaction:</strong> Reject the part and notify the line lead</li></ul><p>The torque controller records 38 Nm.</p><p>In a disconnected setup, the controller just stores the value locally. A technician has to find the failed reading, trace it to the right part, and confirm the reaction was taken.</p><p>With the characteristic mapped to the measurement stream, that same 38 Nm reading is evaluated the instant it's captured. The system already knows the characteristic, the part, the location, the timestamp, and the applicable limit. The part gets held, the line lead is notified, and the event lands in the production record, without anyone hunting for it after the fact.</p><h2 id="where-this-fits-in-the-data-architecture">Where this fits in the data architecture</h2><p>Measurement data comes from PLCs, gauges, CMMs, torque controllers, vision systems, and other floor equipment. Wherever it originates, it has to be <a href="https://flowfuse.com/blog/2025/06/structuring-storing-data-mes-integration/">collected, tied to production context</a>, checked against the applicable limits, and routed to whatever handles the next step.</p><p>FlowFuse can sit between these systems as the integration layer, pulling data from sources like <a href="https://flowfuse.com/blog/2025/07/reading-and-writing-plc-data-using-opc-ua/">OPC UA</a>, <a href="https://flowfuse.com/blog/2025/09/using-modbus-with-flowfuse/">Modbus</a>, and <a href="https://flowfuse.com/blog/2024/06/how-to-use-mqtt-in-node-red/">MQTT</a>, adding production context, checking it against configured limits, and routing anything out of spec to an <a href="https://flowfuse.com/blog/2025/06/what-is-mes/">MES</a>, notification system, or quality database.</p><p>The control plan stays in the system the quality team already manages. The measurement workflow uses its requirements to evaluate production data and trigger the right response.</p><h2 id="verifying-the-control-plan-was-followed">Verifying the control plan was followed</h2><p>Once control plan characteristics are mapped to production measurements, compliance becomes directly queryable. For any characteristic, you can see:</p><ul><li>Coverage: were all required inspections completed?</li><li>Conformance: were measurements within the limits in effect at the time?</li><li>Response: for out-of-spec results, was the reaction plan followed, and how quickly?</li></ul><p>An audit becomes a report, not a multi-day export-and-match exercise. You can answer "show every bore diameter check from Station 30 last quarter and prove every out-of-spec result was caught and contained" from one traceable record. Proving nothing out of spec left the building takes one more link, to part genealogy and dispatch records. That link is only worth building once the measurement side underneath it is trustworthy.</p><p><strong>Connect your control plans to production data</strong></p><p>See how FlowFuse integrates measurement data from OPC UA, Modbus, and MQTT sources with your control plan requirements to automate quality reactions in real time.</p><p><a href="https://flowfuse.com/contact-us/">Contact Us</a></p>]]></content>
        <updated>2026-08-28T00:00:00.000Z</updated>
        <link href="https://flowfuse.com/blog/2026/08/control-plans/"/>
        
    </entry>
    <entry>
        <id>https://flowfuse.com/blog/2026/08/dashboard-themes-and-rendering-fixes/</id>
        <title>FlowFuse Dashboard 1.31.0: Five Themes for a Dark Mode Dashboard</title>
        <summary>Node-RED Dashboard themes get five new presets in 1.31.0, making it easier to build a dark mode dashboard, with fixes for charts, gauges, tables, and more.</summary>
        <content type="html"><![CDATA[<p><a href="https://flowfuse.com/platform/dashboard/">FlowFuse Dashboard</a> 1.31.0 adds five built-in themes, giving you everything you need to build a dark mode dashboard, along with layout improvements for charts, buttons, and gauges. Previously, dark mode had contrast issues across widgets, charts collapsed to empty boxes at their default size, long button labels clipped mid-word, and gauges got sliced off by their own card.</p><p>This release ships alongside FlowFuse 3.0; <a href="https://flowfuse.com/blog/2026/08/flowfuse-release-3-0/">see what else is new in that announcement</a>.</p><p>What's new in FlowFuse Dashboard 1.31.0:</p><ul><li>Five built-in themes — Light, Dark, Dracula, Nord, Sepia — all WCAG AA contrast compliant</li><li>Everything you need to build a dark mode dashboard: date pickers, charts, gauges, and icons all render legibly</li><li>Charts draw at their default size; no more empty boxes on auto-height</li><li>Long button labels wrap or truncate instead of clipping mid-word</li><li>Gauges size and draw correctly on auto</li><li>Table date/time columns render in the viewer's own local timezone</li></ul><h2 id="node-red-dashboard-themes-build-a-better-light-dark-mode-dashboard-with-flowfuse-dashboard">Node-RED Dashboard Themes: Build a Better Light &amp; Dark Mode Dashboard with FlowFuse Dashboard</h2><p>Choose from five built-in Node-RED Dashboard themes in FlowFuse Dashboard: Light, Dark, Dracula, Nord and Sepia. The selected theme applies across every page, group and widget.</p><p>Until now you got one white-and-blue default. Changing it meant hand-editing ten theme values, or writing CSS against Vuetify class names to reach anything the theme didn't expose.</p><p>If you built a dark mode FlowFuse dashboard before this release, native date and time pickers rendered black on black. Chart text sat at a contrast ratio you couldn't read across a desk. Icons stayed dark while the text around them flipped.</p><p>All five themes now meet WCAG AA contrast for text and icons. On the dark themes, date and time pickers, charts, gauges and markdown all render legibly.</p><p><img alt="Switching between the five built-in themes — Light, Dark, Dracula, Nord and Sepia" data-zoomable="" src="https://flowfuse.com/blog/2026/08/images/dashboard-themes.gif"/></p><p>Existing FlowFuse dashboards keep the theme they have. Nothing changes unless you pick a preset, and if you already built a dark mode FlowFuse dashboard by hand, it renders better than it did.</p><h2 id="flowfuse-dashboard-charts-draw-at-their-default-size">FlowFuse Dashboard charts draw at their default size</h2><p>Add a chart, leave the size at auto, deploy. You get a chart.</p><p>Previously you got a title and an empty box. A chart set to auto height collapsed to a single 48-pixel row, and since a chart has no natural height of its own, it drew nothing at all. The workaround was to guess pixel heights until something appeared and that assumed you'd worked out sizing was the problem in the first place. The empty box gave you no clue.</p><h2 id="flowfuse-dashboard-buttons-wrap-long-labels-instead-of-clipping-them">FlowFuse Dashboard buttons wrap long labels instead of clipping them</h2><p>A button labelled "Acknowledge compressor fault" now wraps onto a second line instead of being sliced at both ends. Long labels wrap across up to two lines, and anything beyond that truncates cleanly with an ellipsis rather than losing characters from the start and finish of the text.</p><p>If your FlowFuse dashboard carries equipment names or fault descriptions, this is the fix you'll notice first.</p><h2 id="flowfuse-dashboard-gauges-size-correctly-on-auto">FlowFuse Dashboard gauges size correctly on auto</h2><p>Gauges no longer leave a band of dead space above them as the screen narrows, and the card edge no longer slices them off.</p><p>Three-quarter gauges size correctly on auto, and the needle dial draws at the right proportions. If you run gauges on a wall-mounted screen, they'll look deliberate rather than approximate.</p><h2 id="flowfuse-dashboard-tables-show-real-dates-not-raw-timestamps">FlowFuse Dashboard tables show real dates, not raw timestamps</h2><p>Set a <code>ui-table</code> column to date, time or datetime and it renders as a readable date, formatted in the viewer's own locale.</p><p>A timestamp column used to show <code>1735689600000</code>. Getting a date out of it meant adding a function node to reformat every row before it reached the table — which also baked in one timezone. Formatting now happens in the browser, so someone in Stuttgart and someone in Detroit each see their own local time from the same flow.</p><p><img alt="A ui-table column set to datetime rendering a readable, locale-aware date instead of a raw timestamp" data-zoomable="" src="https://flowfuse.com/blog/2026/08/images/dashboards-table-timestamps.gif"/></p><p>See the <a href="https://dashboard.flowfuse.com/nodes/widgets/ui-table.html" rel="nofollow">ui-table documentation</a> for the column types.</p><h2 id="smaller-fixes-in-flowfuse-dashboard-1310">Smaller fixes in FlowFuse Dashboard 1.31.0</h2><ul><li><strong>Editing one theme changes only that theme.</strong> Changing a colour used to change it on every theme not assigned to a page.</li><li><strong>Tables fill the height you give them.</strong> Set a table to a fixed size and it used to clamp to a single row, hiding everything below the first. Now it fills the widget.</li><li><strong>Text input renders correctly as a multi-line text area.</strong> It used to render partially.</li></ul><h2 id="thank-you-to-our-contributors">Thank you to our contributors</h2><p>This release includes a fix from <strong><a href="https://github.com/waldbaer" rel="nofollow">waldbaer</a></strong>, who solved widget ordering inside subflows (<a href="https://github.com/FlowFuse/node-red-dashboard/issues/710" rel="nofollow">#710</a>). Put a widget in a subflow where the group already held two others and you couldn't position it between them — it stuck to the top or the bottom whatever you did. waldbaer tracked it down and fixed it.</p><p>Thanks as well to everyone filing issues with reproduction steps and screenshots. Several fixes above came from reports that included exactly what we needed to reproduce the problem — <a href="https://github.com/FlowFuse/node-red-dashboard/issues/151" rel="nofollow">#151</a>, <a href="https://github.com/FlowFuse/node-red-dashboard/issues/1607" rel="nofollow">#1607</a> and <a href="https://github.com/FlowFuse/node-red-dashboard/issues/1772" rel="nofollow">#1772</a> among them. That saves us hours, and it goes straight into what ships.</p><h2 id="where-flowfuse-dashboard-is-going">Where FlowFuse Dashboard is going</h2><p>Our goal is that you can build a real operator screen with FlowFuse Dashboard — the kind mounted next to a production line: glanceable, green when things are running, red when they aren't, readable from across the room. Today, FlowFuse Dashboard builds a good data dashboard. It doesn't yet build an HMI.</p><p>Two things stand in the way, and they're what the next two releases are about.</p><p><strong>The first is that FlowFuse Dashboard is message-driven.</strong> A widget shows whatever the last message told it, and shows nothing until one arrives. That's fine on a laptop while you're building. It's a problem on a screen next to a machine, where an operator walks up mid-shift and needs the state of the line right now.</p><p><strong>Tags</strong> fix that. Define a named, typed data point once, feed it from wherever your data comes from, and bind widgets to it. FlowFuse Dashboard holds the value server-side, so a page renders real state the moment it opens. Tags also carry what industrial data needs and messages don't: a type, a range, warning and alarm limits.</p><p><strong>The second is that you can only arrange widgets in a grid.</strong> Every widget is a rectangle that flows into rows and columns. That works for a set of charts and readouts. It can't give you a picture of your process: three tanks with the pipes between them, a motor symbol that spins while it's running, a temperature sitting on top of the vessel it came from.</p><p><strong>Canvas</strong> is a new page type you draw on. Drop shapes and industrial symbols wherever you want them, bind each one to a tag, and set rules like green in range and red out of range.</p><p>We're still working out the shape of both, including where tags should live. If you're running FlowFuse dashboards across machines, sites or lines, tell us what you'd bind, what you'd want stored, and what would have to be true for this to replace how you wire data today.</p><p>Tell us <a href="https://flowfuse.com/dashboard/tags-and-canvas-feedback/">on this form</a>.</p><h2 id="flowfuse-dashboard-1310-faq">FlowFuse Dashboard 1.31.0 FAQ</h2><h3 id="how-do-i-change-the-color-scheme-of-my-flowfuse-dashboard">How do I change the color scheme of my FlowFuse Dashboard?</h3><p>Pick a theme from the dropdown — Light, Dark, Dracula, Nord, or Sepia. Every page, group, and widget updates automatically, and existing FlowFuse dashboards keep their current look until you choose one.</p><h3 id="will-switching-to-flowfuse-dashboards-dark-mode-break-my-existing-flows">Will switching to FlowFuse Dashboard's dark mode break my existing flows?</h3><p>No. Your FlowFuse dashboard keeps the theme it already has. Nothing changes unless you actively select a preset from the dropdown.</p><h3 id="does-this-fix-apply-to-self-hosted-flowfuse-dashboard-instances-or-only-flowfuse-cloud">Does this fix apply to self-hosted FlowFuse Dashboard instances, or only FlowFuse Cloud?</h3><p>Both. FlowFuse Dashboard is an open source npm package that installs into any Node-RED instance, whether you run it on FlowFuse Cloud or your own hardware.</p><p>This feature is available to all users from FlowFuse Dashboard v1.31.0, open source under Apache 2.0.</p><p><strong>See how FlowFuse works in real environments</strong></p><p>Walk through real use cases and see how teams connect systems, automate workflows, and deploy at scale.</p><p><a href="https://flowfuse.com/book-demo/">Book a Demo</a></p>]]></content>
        <updated>2026-08-27T00:00:00.000Z</updated>
        <link href="https://flowfuse.com/blog/2026/08/dashboard-themes-and-rendering-fixes/"/>
        
    </entry>
    <entry>
        <id>https://flowfuse.com/blog/2026/08/flowfuse-release-3-0/</id>
        <title>FlowFuse 3.0: Build, deploy, and govern — matched to how you run</title>
        <summary>FlowFuse 3.0 introduces three new products - Flowfuse Edge, FlowFuse Hub, and FlowFuse Fleet - now allows connecting your own AI agent and brings updates to Dashboards.</summary>
        <content type="html"><![CDATA[<p>FlowFuse exists to do one thing well: help teams build, deploy, and govern the operational applications that run their production. This goes from a single data center to every machine on the plant floor to thousands of devices in the field.</p><p>FlowFuse 3.0 sharpens that promise. We reorganized the way you buy the platform around how you actually work, so the edition you run matches your use case and you get exactly what you need out of the box. We also made updates that move the build experience forward: faster app creation, more usable dashboard interface, and additional certified connectivity.</p><h2 id="introducing-flowfuse-hub-edge-and-fleet">Introducing FlowFuse Hub, Edge, and Fleet</h2><h3 id="which-flowfuse-product-should-i-use">Which FlowFuse Product Should I Use?</h3><p>Until now, picking the right FlowFuse setup meant reasoning about tiers. FlowFuse 3.0 replaces that with three clearly-positioned products, each built around a real deployment shape:</p><h4 id="flowfuse-hub-integrate-enterprise-systems-and-apis">FlowFuse Hub: Integrate Enterprise Systems and APIs</h4><p><a href="https://flowfuse.com/product/hub/">FlowFuse Hub</a> is for IT teams. Integrate and orchestrate data across enterprise systems, APIs, and databases, with centralized governance.</p><p>Hub fits teams moving data between ERPs, databases, and cloud APIs, where the applications live in a data center rather than on a plant floor.</p><h4 id="flowfuse-edge-connect-plcs-and-machines-across-sites">FlowFuse Edge: Connect PLCs and Machines Across Sites</h4><p><a href="https://flowfuse.com/product/edge/">FlowFuse Edge</a> is for OT teams. Deploy, manage, and scale industrial applications across sites, with certified industrial connectivity and centralized governance.</p><p>Edge fits teams connecting PLCs, machines, and systems, and businesses standardizing automation across multiple plants. Certified nodes ship with Edge, so the protocols your flows depend on come tested and supported rather than maintained by volunteers.</p><h4 id="flowfuse-fleet-manage-node-red-on-distributed-devices">FlowFuse Fleet: Manage Node-RED on Distributed Devices</h4><p><a href="https://flowfuse.com/product/fleet/">FlowFuse Fleet</a> is for large IoT deployments. Run managed Node-RED across distributed field devices, with remote flow updates and fleet-wide visibility.</p><p>Fleet fits telemetry collection, distributed device deployments, and hardware and OEM partners shipping FlowFuse to their own customers. Where Edge gives you depth at each site, Fleet gives you reach across thousands of them.</p><p>It's the same strong platform underneath. The difference is which problem each one is tuned for — data center, manufacturing site, or a distributed fleet — so the path from "sign up" to "in production" is shorter for every team, making everything easier from POCs to prod and scaling.</p><p>Every product is enabled by FlowFuse Expert, and every product connects the AI agent you already use.</p><h2 id="build-faster-from-idea-to-working-application">Build: faster from idea to working application</h2><p>FlowFuse 3.0 makes it easier to go from an idea to a working application, with new AI capabilities and a more intuitive dashboard experience. Describe what you want to build, and <a href="https://flowfuse.com/docs/user/expert/">FlowFuse Expert</a> helps assemble it.</p><h3 id="connect-your-own-ai-agent">Connect Your Own AI Agent</h3><p>Expert works through a set of tools on the FlowFuse MCP server. In 3.0, it stops being the only agent that can use them.</p><p>Add the FlowFuse MCP server to whichever AI agent you already use, sign in, and choose which teams it can reach and whether it has editing rights. Microsoft Copilot, ChatGPT, Claude and Gemini all connect this way, as does a local agent with MCP capabilities running any model. Command-line agents use the same address as well and all have access to the same tools as our integrated agent.</p><p>This way the AI your company already approved can be extended with FlowFuse and Node-RED, under the same governance you already have in place. The agent you are familiar with, now extended.</p><p>Tell it what you want to build and it will build it for you with what the platform offers including applications, hosted and remote instances, snapshots, mqtt brokers, tables, device groups, or the materials in your team library like custom nodes from submodules or blueprints. It will navigate your browser session to the Node-RED editor so it can build it out in front of you, read the debug output, and correct its own node configuration when needed. You stay in control, you can watch it happen and take over at any point.</p><p>Three things follow from that:</p><ul><li><strong>Company-sanctioned AI, unlocked.</strong> Govern and secure agentic development and orchestration at scale.</li><li><strong>Your agent, your setup.</strong> Each engineer stays in the agent they already work in, next to their existing MCP servers and customizations.</li><li><strong>One workflow.</strong> FlowFuse platform operations and Node-RED flow editing become a natural extension of the AI workflow you already own leading you to more efficiently and effectively deliver results.</li></ul><p>FlowFuse ensures control and enforces on every call what you granted: the teams, and read access or editing rights. Visual coding work runs in one of your own browser sessions making sure you have visibility and which ends when you close the tab. Every action lands in the audit log attributed to you and marked <code>via MCP</code>.</p><p><a href="https://flowfuse.com/ai/">Pick your agent on the AI page</a> to get setup in three simple steps.</p><p><video auto-play loop muted plays-inline aria-label="Connecting an AI agent to FlowFuse over MCP, granting it a team and an access level, then asking it to set up an instance" width="1600" height="900" preload="none"><source src="https://flowfuse.com/blog/2026/08/images/connect-your-own-ai-agent.webm" type="video/webm"></source></video><em>Connect the agent you already use, grant it a team and an access level, and work with FlowFuse from there.</em></p><h3 id="whats-new-with-flowfuse-dashboard">What's new with FlowFuse Dashboard?</h3><p><a href="https://dashboard.flowfuse.com/" rel="nofollow">FlowFuse's Dashboard</a> v1.31.0 delivers a round of UX and UI improvements — the low-friction fixes that make building and reading a dashboard feel obvious instead of fiddly. <a href="http://dashboard.flowfuse.com/nodes/config/ui-theme.html" rel="nofollow">Built-in themes for Node-RED Dashboard 2.0 lead the release</a>: predictable to edit, and every preset meets WCAG AA contrast, so dark mode stays legible. Charts render instead of leaving empty boxes. Tables show readable dates instead of raw epoch numbers. Plus a run of smaller UI fixes — labels and gauges that stay inside their cards, spacing that holds at narrow widths. Less setup. More dashboard.</p><p><video auto-play loop muted plays-inline aria-label="Node-RED Dashboard theme showcase, switching between Light, Dark, Dracula, Nord, and Sepia themes" width="1000" height="517" preload="none"><source src="https://flowfuse.com/blog/2026/08/images/dashboard-theme-showcase.webm" type="video/webm"></source></video><em>Five built-in themes, one dropdown, all meet WCAG AA contrast.</em></p><p><video auto-play loop muted plays-inline aria-label="Node-RED Dashboard table showing a date formats column rendering epoch values as readable dates" width="1000" height="571" preload="none"><source src="https://flowfuse.com/blog/2026/08/images/dashboard-table-date-formats.webm" type="video/webm"></source></video><em>Set the column type to Date, Time, or Datetime. Epoch values format themselves.</em></p><h2 id="deploy-to-the-edge-at-any-scale">Deploy: to the edge, at any scale</h2><p>The Hub / Edge / Fleet split is, at its core, a deployment story. Whether your applications live in a data center, run per manufacturing site, or spread across thousands of small instances in the field, 3.0 gives you a product shaped for that reality rather than a one-size-fits-all tier. Deploying to the edge and scaling out stop being exceptions you work around and start being the default the product expects.</p><p>Running at the edge starts with our Device Agent; it provides the bridge back to the FlowFuse platform. We’re continuing to improve the entire experience of getting setup with the Device Agent - making it as easy as possible to install while retaining flexibility in how you want it set up. This release of the installer guides you through more options on where the agent gets installed and how it gets run - making it easier than ever to get running on your hardware.</p><h2 id="govern-centralized-control-wherever-flows-run">Govern: centralized control wherever flows run</h2><p>As soon as applications spread across sites and devices, the hard part shifts from building them to keeping them under control. Every 3.0 product carries centralized governance through the same lens — <a href="https://flowfuse.com/docs/user/role-based-access-control/">role-based access control</a>, <a href="https://flowfuse.com/docs/user/logs/#audit-log">audit logging</a>, and a single place to see and manage what's running — so extending to the edge doesn't mean giving up oversight. One team, one set of controls, whether you're running one instance or a fleet.</p><h2 id="how-do-i-get-started-with-flowfuse-30">How Do I Get Started With FlowFuse 3.0?</h2><p>Explore the <a href="https://flowfuse.com/product/">product page</a> to decide if FlowFuse Edge, FlowFuse Hub, or FlowFuse Fleet is for you. FlowFuse 3.0 is live today on Cloud and Self-Hosted.</p><ol><li><a href="https://app.flowfuse.com/account/create" rel="nofollow">Start a Free Trial of FlowFuse Edge</a>: All OT teams can request a free 30-day trial immediately; if you're looking to try out FlowFuse Hub or FlowFuse Fleet, just <a href="https://flowfuse.com/contact-us/">contact us</a> and we'll make it happen.</li><li>See the full feature set and request <a href="https://flowfuse.com/pricing/">Pricing</a></li><li><a href="https://flowfuse.com/book-demo/">Set up a demo</a> to see all of these new features</li></ol><p>Note: FlowFuse Self-Hosted requires the 3.0 release installed for the new license types and features mentioned in this release.</p><p><strong>Find out which FlowFuse product fits how you run</strong></p><p>Walk through Hub, Edge, and Fleet with our team and leave with the right fit for your deployment, not a generic tier.</p><p><a href="https://flowfuse.com/book-demo/">Book a Demo</a></p>]]></content>
        <updated>2026-08-27T00:00:00.000Z</updated>
        <link href="https://flowfuse.com/blog/2026/08/flowfuse-release-3-0/"/>
        
    </entry>
    <entry>
        <id>https://flowfuse.com/blog/2026/08/containment-action/</id>
        <title>Containment Action and Controlled Shipping: Surviving CS1 and CS2</title>
        <summary>Containment Triggers: CS1 and CS2 are escalations, not automatic responses to a single defect. They follow severity, repeat issues, stop-ship events, or an inadequate response to an earlier corrective action request. Documentation Under Scrutiny: A containment plan only holds up if inspection points, sign-offs, and results are tracked consistently across every site and shift, not just on paper after the fact. Root Cause to Release: Exiting CS1 or CS2 permanently requires connecting containment data to a documented root cause fix and proving consistency across a sustained, defect-free run.</summary>
        <content type="html"><![CDATA[<p><em>A containment action is the set of temporary measures a supplier puts in place to stop a known defect from reaching the customer while the root cause is still under investigation.</em> Extra inspection, quarantined stock, tightened sign-offs: anything that guarantees what ships is clean, even if the process producing it is not yet fixed.</p><p>Controlled shipping is what happens when the automaker stops taking that on trust. It is a formal status assigned after a defect reaches a customer plant, and it comes in two levels. CS1 requires the supplier to add its own inspection layer before shipment, document it, and report on it. CS2 adds an independent third party on top of CS1. The supplier keeps running its own containment; the third party verifies it, at the supplier's cost.</p><p>Both are survivable. What makes them hard is not the inspection itself. It is proving, shipment after shipment and site after site, that the inspection actually happened the way you said it did. Most MES platforms handle single-site nonconformance well. Producing one consistent containment record across several plants on a two-week timeline is where they tend to fall short.</p><h2 id="what-triggers-cs1-and-cs2-controlled-shipping">What Triggers CS1 and CS2 Controlled Shipping</h2><p>A defect reaching the customer plant is the starting point, but controlled shipping is an escalation beyond it. Automakers apply it when the defect is severe, when a previously closed issue resurfaces, when a line stops, or when the initial corrective action response falls short. A defect caught at incoming inspection, a field failure, or a warranty claim can each lead there. CS1 typically requires the supplier to add an extra layer of inspection before shipment, while CS2 means the automaker brings in a third party to inspect on the supplier's behalf, at the supplier's cost. Both carry real financial and reputational stakes.</p><p>For <a href="https://flowfuse.com/industries/automotive/">automotive quality manufacturing</a>, the trigger event is rarely the hard part. The harder part is proving, with data, that every unit shipped afterward meets the added inspection requirement. Without a system connecting inspection points to production data in real time, that proof often depends on manual logs that are slow to compile and easy to dispute during a customer audit.</p><a href="https://flowfuse.com/book-demo/"><img src="https://flowfuse.com/blog/2026/08/images/containment-blog-cta-1.png" alt="Replace manual containment logs - see how it works"/></a><h2 id="building-containment-that-holds-up-under-scrutiny">Building Containment That Holds Up Under Scrutiny</h2><p>Surviving CS1 or CS2 status depends on more than reacting to the initial defect notice. Automakers and third-party auditors expect proof that every containment action is documented, repeatable, and traceable back to a specific inspection point and operator sign-off. Building that level of rigor across multiple sites, each with its own systems and habits, requires structure in three key areas.</p><h3 id="documenting-every-inspection-point">Documenting Every Inspection Point</h3><p>Every added inspection step needs a written record: what is being checked, how often, and by whom. Inspection also has to happen in a dedicated containment area, separate from normal production flow, staffed by people other than the operators who produced the part. Real-time <a href="https://flowfuse.com/use-cases/production-monitoring/">production monitoring</a> can capture this automatically at the line level, giving you a live record instead of a stack of paper checklists compiled after each shift. It's the same discipline a <a href="https://flowfuse.com/blog/2026/08/layered-process-audit/">layered process audit</a> runs on: defined checks, at a defined frequency, signed off by someone other than the operator.</p><h3 id="sign-offs-that-hold-up-during-customer-containment">Sign-Offs That Hold Up During Customer Containment</h3><p>Customer containment often involves the automaker's own quality team reviewing supplier data directly. A shared <a href="https://flowfuse.com/platform/dashboard/">FlowFuse Dashboard</a> gives operators, quality engineers, and customer auditors the same live view of inspection results, so sign-offs reflect what actually happened on the line, not a summary written after the fact.</p><h3 id="where-cs1cs2-automotive-plans-break-down">Where CS1/CS2 Automotive Plans Break Down</h3><p>Most CS1/CS2 automotive plans fail at scale, not on day one. A process that works on a single line becomes inconsistent across five plants using different spreadsheets and different definitions of "checked." Standardizing the same containment action across every site closes that gap without rebuilding it at each location.</p><h3 id="identifying-certified-stock">Identifying Certified Stock</h3><p>Contained parts need distinct marking, usually a containment label or coloured tag, agreed with the customer and applied from a defined start date. That marking is how the customer separates parts that passed containment inspection from parts shipped before containment began. Containment also covers material sitting in your warehouse, already in transit, and on the floor at the customer's plant, not only what ships next. That marking needs to tie back to the same <a href="https://flowfuse.com/blog/2026/08/automotive-traceability/">automotive traceability</a> record as everything else you ship, not a separate log that only exists for the duration of containment.</p><h2 id="from-customer-containment-to-exiting-cs1-and-cs2-for-good">From Customer Containment to Exiting CS1 and CS2 for Good</h2><p>Passing containment inspections is only half the work. To exit CS1 or CS2 status permanently, a supplier has to show the automaker that the root cause has been identified and corrected, not just contained. If the correction changes the process, tooling, or a sub-supplier, the automaker may also require a new <a href="https://flowfuse.com/blog/2026/09/ppap/">PPAP</a> submission before the change is approved. That shift from reactive inspection to lasting correction happens across three areas.</p><h3 id="connecting-containment-data-to-root-cause">Connecting Containment Data to Root Cause</h3><p>Containment inspection data is only useful if it points back to where the defect originated. Ongoing <a href="https://flowfuse.com/blog/2026/07/defect-and-quality-monitoring/">defect and quality monitoring</a> at the line level helps quality teams trace a recurring issue to a specific machine, shift, or process step. Structuring that investigation with a tool like an <a href="https://flowfuse.com/blog/2026/07/ishikawa-fishbone-diagram/">Ishikawa fishbone diagram</a> keeps the search organized instead of guessing at a fix.</p><a href="https://app.flowfuse.com/account/create"><img src="https://flowfuse.com/blog/2026/08/images/containment-action-cta-2.png" alt="Track contained parts from line to customer - build with FlowFuse"/></a><h3 id="keeping-every-shift-aligned-on-corrective-action">Keeping Every Shift Aligned on Corrective Action</h3><p>Corrective action fails when one shift changes a process and the next shift reverts it. Clear <a href="https://flowfuse.com/use-cases/shop-floor-communication/">shop floor communication</a> keeps operators, quality engineers, and plant leadership working from the same updated procedure, reducing the risk of the same defect resurfacing after containment is lifted.</p><h3 id="proving-consistency-before-requesting-release">Proving Consistency Before Requesting Release</h3><p>Automakers typically require a sustained defect-free run before lifting controlled shipping status. Every containment action taken during that run needs a documented, consistent trail across shifts and lines, giving the supplier a clear case to present when requesting release from CS1 or CS2.</p><h2 id="final-thoughts">Final Thoughts</h2><p>CS1 and CS2 status test more than a supplier's quality process. They test whether that process can be documented, trusted, and applied the same way across every site under scrutiny, often on a timeline that leaves no room for rebuilding tools from scratch at each plant. The suppliers who exit controlled shipping fastest are usually the ones who can prove consistency without relying on manual logs and disconnected spreadsheets to make their case.</p><p>An industrial application platform like FlowFuse gives manufacturers a way to standardize that proof once and apply it everywhere it is needed, from inspection tracking to shift communication to root cause data. Getting through CS1 or CS2 is difficult enough without also rebuilding the containment process at every site. Build it once, and let it run everywhere containment is required.</p><p><strong>Build containment you can prove</strong></p><p>Talk to us about connecting inspection data, sign-offs, and root cause tracking so your containment action holds up across every site.</p><p><a href="https://flowfuse.com/book-demo/">Book a Demo</a></p>]]></content>
        <updated>2026-08-26T00:00:00.000Z</updated>
        <link href="https://flowfuse.com/blog/2026/08/containment-action/"/>
        
    </entry>
    <entry>
        <id>https://flowfuse.com/blog/2026/08/safe-launch/</id>
        <title>Safe Launch: The Post-PPAP Monitoring Period</title>
        <summary>Safe Launch Starts Where PPAP Ends: PPAP proves capability over a significant production run, typically 300 consecutive parts. A safe launch program proves the process holds that capability over months, across every shift, operator, and a full tooling wear cycle. Escalation Beats Observation: Safe launch is already a containment event. Defined thresholds tied to live production data catch a drift before it turns into a customer complaint or an extension of the containment period. Containment Data Should Outlive the Launch: Insights captured during early production containment can be standardized into reusable operational applications, giving future launches a stronger starting point across every plant.</summary>
        <content type="html"><![CDATA[<p><em>PPAP approval feels like the finish line. For most suppliers, it is the point at which the customer starts watching most closely.</em> Different OEMs give this period different names. GM calls it GP-12, or early production containment. Ford and others call it safe launch. The requirement is broadly the same: a defined window of additional inspection sitting on top of your normal process controls, starting at first production shipment and ending only when the customer says so.</p><h2 id="what-is-a-safe-launch-automotive-program-and-why-does-it-start-after-ppap">What is a Safe Launch Automotive Program, and Why Does it Start After PPAP?</h2><p>A safe launch program is a defined containment period that runs from the first production shipment. It usually follows <a href="https://flowfuse.com/blog/2026/09/ppap/">PPAP</a> approval, though a supplier operating under interim approval is often required to contain from day one. PPAP proves capability over a significant production run, typically 300 consecutive parts at production rate on production tooling. Safe launch proves the process holds that capability over months, across every shift, every operator, and a full tooling wear cycle. For manufacturers running <a href="https://flowfuse.com/industries/automotive/">automotive manufacturing solutions</a> across multiple plants, that distinction matters because failure modes at launch rarely match what showed up in validation.</p><p>This is why safe launch exists as its own phase. A redundant inspection layer, tighter reaction limits, and faster escalation paths catch issues that a one-time approval cannot. In most programs this means 100% inspection of specified characteristics, carried out separately from the normal in-process checks, not a higher sampling rate. Without them, defects can reach hundreds of vehicles before anyone notices a trend, turning a manageable process shift into a costly field action.</p><a href="https://flowfuse.com/book-demo/"><img src="https://flowfuse.com/blog/2026/08/images/safe-launch-cta-1.png" alt="See your safe launch containment data the way your customer does"/></a><h2 id="building-a-safe-launch-plan-for-the-post-ppap-monitoring-period">Building a Safe Launch Plan for the Post-PPAP Monitoring Period</h2><p>A safe launch plan gives structure to what would otherwise be a loosely managed monitoring period. It defines how long the elevated scrutiny lasts, what triggers an escalation, and who owns the response when a defect trend appears. Four elements determine whether that plan actually works on the shop floor.</p><h3 id="containment-inspection-that-sits-on-top-of-normal-controls">Containment Inspection That Sits On Top of Normal Controls</h3><p>Containment inspection is additional, not a substitute. It runs at a dedicated station downstream of the normal process, covering the characteristics the customer specified, usually at 100%. Operators need to see which characteristics are under containment and what the current results look like, on the line, in the shift they are working. Real-time <a href="https://flowfuse.com/use-cases/production-monitoring/">production monitoring</a> turns that into a live view instead of a paper checklist.</p><h3 id="escalation-criteria-everyone-understands">Escalation Criteria Everyone Understands</h3><p>A safe launch plan fails when escalation depends on someone noticing a problem manually. Defined thresholds, tied to real-time production monitoring data, remove that guesswork and route alerts to the right person before a trend becomes a containment event.</p><h3 id="exit-criteria-set-by-the-customer-proven-by-you">Exit Criteria Set by the Customer, Proven by You</h3><p>The customer defines the exit criteria at the start, usually a combination of elapsed time, cumulative volume, and zero containment defects. You cannot exit unilaterally. You build the evidence, request release, and wait for sign-off. A defect found during the window normally resets the clock rather than simply extending it, which makes a clean, continuous record worth more than a strong average.</p><h3 id="identification-of-contained-parts">Identification of Contained Parts</h3><p>Parts that clear containment inspection carry a customer-agreed label or mark, applied from a defined start date, so the receiving plant can tell contained stock from anything shipped before the program began. Missing or inconsistent identification is one of the most common reasons a containment period gets extended.</p><a href="https://app.flowfuse.com/account/create"><img src="https://flowfuse.com/blog/2026/08/images/safe-launch-cta-2.png" alt="Route safe launch escalations before they become containment events"/></a><h2 id="early-production-containment-turning-launch-data-into-long-term-quality-gains">Early Production Containment: Turning Launch Data Into Long-Term Quality Gains</h2><p>Early production containment generates a large volume of data in a short window, but most of that data gets archived once launch monitoring ends. This is a missed opportunity. The same data used to catch defects during launch can improve quality processes well beyond it: three approaches make that connection possible.</p><h3 id="feed-containment-data-into-standard-quality-workflows">Feed Containment Data Into Standard Quality Workflows</h3><p>Containment findings should not disappear once a program exits its monitoring period. Applying the same defect and quality monitoring logic used during launch to standard production keeps defect detection sharp long after containment ends.</p><h3 id="use-launch-insights-to-improve-future-programs">Use Launch Insights to Improve Future Programs</h3><p>Every launch surfaces failure modes specific to a part, process, or line. Capturing those patterns in a reusable operational application means the next launch starts with better containment plans and escalation thresholds instead of starting from scratch.</p><h3 id="standardize-containment-logic-across-plants">Standardize Containment Logic Across Plants</h3><p>A containment workflow built for one line can run at every site without rebuilding it, following FlowFuse's build once, run everywhere approach to <a href="https://flowfuse.com/industries/automotive/">automotive manufacturing</a>, so standardized workflows scale across brownfield environments instead of starting over at each plant.</p><h2 id="final-thoughts">Final Thoughts</h2><p>A safe launch program only works when it treats the post-PPAP period as its own discipline, not an extension of validation. That means containment inspection layered on top of normal controls, escalation paths that do not depend on manual observation, and exit criteria the customer sets and you prove. Getting this right protects against the kind of defect trends that turn into costly field actions.</p><p>The bigger opportunity is what happens to that containment data afterward. Instead of archiving it once monitoring ends, manufacturers can carry those insights into standard quality workflows and future launches. An industrial application platform like FlowFuse makes that possible by letting quality teams build a containment workflow once and run it everywhere it's needed, so every new launch starts ahead of the last one instead of rebuilding the process from scratch.</p><p><strong>Get your next launch off to a clean start</strong></p><p>Talk to us about connecting inspection points, escalation criteria, and containment reporting so you can prove your safe launch program held up and exit with confidence.</p><p><a href="https://flowfuse.com/book-demo/">Book a Demo</a></p>]]></content>
        <updated>2026-08-25T00:00:00.000Z</updated>
        <link href="https://flowfuse.com/blog/2026/08/safe-launch/"/>
        
    </entry>
    <entry>
        <id>https://flowfuse.com/blog/2026/08/run-at-rate/</id>
        <title>Run at Rate: Proving Production Capacity Before Launch</title>
        <summary>Run at rate verifies that a production line can meet its required output using production tooling, staffing, and standard processes. The demonstrated rate is based on good parts produced against theoretical output at the target cycle time, with the customer or program team setting the pass threshold.</summary>
        <content type="html"><![CDATA[<p><em>Run at rate is a timed production run, performed at the actual target cycle time with production tooling and production staffing, meant to confirm a line can hold both quality and output over a real shift, not just a handful of closely watched parts.</em></p><p>The distinction matters because process validation alone doesn't prove it. A supplier can pass validation with every checked part coming back within spec, launch, and still miss its shift target three weeks in, at which point it's a customer problem instead of an engineering one. Run at rate is the check meant to catch that before launch happens, not after.</p><a href="https://flowfuse.com/book-demo/"><img src="https://flowfuse.com/blog/2026/08/images/run-at-rate-cta2.png" alt="Need to prove production capacity before launch?"/></a><h2 id="where-the-requirement-comes-from">Where the requirement comes from</h2><p>General Motors formalized the requirement in its <a href="https://www.scribd.com/document/572952029/GM-1927-35-Run-at-Rate-Procedure-Rev-2-EG" rel="nofollow">GM Global APQP Supplier Quality Manual (GM 1927)</a>, performed after PPAP approval as confirmation of the rate claimed on the supplier's warrant. Ford builds it into the PPAP submission itself, through the capacity evaluation section of the official <a href="https://www.aiag.org/training-and-resources/manuals" rel="nofollow">AIAG Production Part Approval Process (PPAP) Manual</a>. Stellantis standardizes its version via the <a href="https://www.google.com/search?q=https://www.supplier.stellantis.com" rel="nofollow">Stellantis Supplier Portal</a> Capacity Assessment Tool (CAT) framework. German OEMs execute a two-day trial called 2 Tagesproduktion (2TP), governed by the <a href="https://webshop.vda.de/qmc/volume-2-ppa" rel="nofollow">VDA QMC Volume 2 PPA Standard</a>.</p><p>The paperwork varies by customer. The question underneath it doesn't: can this line, with this tooling and these operators, actually produce at the rate that was quoted.</p><h2 id="requirements-for-a-valid-run">Requirements for a valid run</h2><p>A few conditions have to hold.</p><p>The setup has to match real production, not a demo. Production tooling, production gauges, trained operators, standard work as documented. Auditors specifically watch for stand-ins, an engineer hovering over a fixture, hand-picked material, extra staff who wouldn't be on the floor during a normal shift. Any of that and the result doesn't count.</p><p>The run has to cover enough time to mean something. A line can hold <a href="https://flowfuse.com/blog/2025/09/what-is-takt-time/">takt time</a> for twenty minutes and still drift once fixtures heat up and operators settle into a real pace instead of a rehearsed one. That's why most programs require a full shift or a defined multi-hour window rather than a short burst at rate.</p><p>And everything counts against the result, not just the good parts. <a href="https://flowfuse.com/blog/2026/07/build-downtime-logger/">Downtime</a>, changeovers, scrap, and rework all subtract from the demonstrated rate.</p><h2 id="how-to-calculate-run-at-rate">How to calculate run at rate</h2><p>The math only needs two numbers: what the line was supposed to produce, and what it actually produced as good parts.</p><p><strong>Theoretical output</strong> = run duration ÷ target cycle time</p><p><strong>Run at rate %</strong> = (net good output ÷ theoretical output) × 100</p><p>Take an 8-hour shift, or 480 minutes, against a 60-second target cycle time. The theoretical output for that window is 480 units.</p><p><img alt="Run at rate calculation diagram showing theoretical output, good parts produced, and resulting percentage" src="https://flowfuse.com/blog/2026/08/images/run-at-rate-calculation-image.png"/></p><p>During the run, 45 minutes are lost to downtime, leaving 435 minutes of actual production time. At the target cycle time, the line produces 435 units, but 12 are scrapped, leaving 423 good parts.</p><p><strong>Run at rate = (423 ÷ 480) × 100 = 88.1%</strong></p><p>Downtime and scrap don't get calculated separately and added back in. They show up as fewer good parts against the theoretical output, which is why a line can be running most of the shift and still post a rate well under target..</p><a href="https://app.flowfuse.com/account/create"><img src="https://flowfuse.com/blog/2026/08/images/run-at-rate-cta-1.png" alt="Tracking run-at-rate data manually?"/></a><h2 id="what-does-pass-or-fail-look-like">What Does Pass or Fail Look Like?</h2><p>The customer or program team sets the required run-at-rate threshold before the test, based on the production capacity that was quoted or required. The threshold varies by customer and program, so 95% is an example rather than a universal requirement.</p><p>If the agreed threshold is 95%, a result of 95% or higher passes. In the example above, the line achieved <strong>88.1%</strong>, so it fails to demonstrate the required capacity. That restarts the clock rather than ending the program: trace the shortfall to downtime, scrap, or cycle drift, fix it, and run again. Until a run passes, the quoted capacity stays unproven, and launch approval waits with it.</p><p><strong>Pass:</strong> ≥ required threshold<br/><strong>Fail:</strong> &lt; required threshold</p><h2 id="run-at-rate-vs-process-validation-vs-ppap">Run at rate vs. process validation vs. PPAP</h2><p>Process validation confirms a process can hold tolerance, usually at reduced volume with an engineer watching each unit come off the line. That's a different test than holding tolerance for 400 consecutive cycles at full speed with nobody intervening, which is what runs at rate checks.</p><p><a href="https://flowfuse.com/blog/2026/09/ppap/">PPAP</a> is the larger documentation package: control plans, measurement system analysis, part approval as a whole. Run at rate is one piece of that package, specific to volume. It isn't a substitute for the rest of the file, and the rest of the file isn't a substitute for it. For how a control plan's characteristics get tied to the measurement data collected on the floor, see <a href="https://flowfuse.com/blog/2026/08/control-plans/">Control Plans: Linking Quality Characteristics to Measurement Data</a>.</p><p><img alt="Comparison diagram showing PPAP components and where run at rate fits within the approval process" src="https://flowfuse.com/blog/2026/08/images/pap-vs-run-rate.png"/></p><h2 id="why-capacity-gaps-still-show-up-after-launch">Why capacity gaps still show up after launch</h2><p>Changeover time gets estimated instead of measured live, and the real changeover, with new operators and no rehearsal, runs longer than planned. A station that tested fine on its own turns out to be the actual bottleneck once the full line runs together, starved for parts or backed up behind a slower neighbor. <a href="https://flowfuse.com/blog/2026/07/defect-and-quality-monitoring">Quality</a> that looked stable during a short trial drifts once tooling wears across a full shift, a failure mode a short run wouldn't catch. If that drift reaches the customer plant, it's the kind of defect that triggers <a href="https://flowfuse.com/blog/2026/08/containment-action/">CS1 or CS2 controlled shipping</a>.</p><p>Some of the challenge comes down to how run-at-rate data is collected. During a live run, cycle times, downtime, production counts, and rejects are often recorded manually, making it difficult to capture every event accurately. Much of this data is already available from the equipment through <a href="https://flowfuse.com/landing/plc/">PLC</a> tags and machine states. A platform like <a href="https://flowfuse.com/">FlowFuse</a> can connect to that equipment to automatically collect the data, calculate the demonstrated production rate, and visualize the results as the run progresses, giving teams a clearer view of how the line is performing against its target.</p><h2 id="why-it-matters">Why it matters</h2><p>Process validation proves a line can make a good part. Run at rate proves it can make good parts fast enough, for long enough, to hit the number in the launch plan. With production data collected directly from your equipment, FlowFuse helps <a href="https://flowfuse.com/industries/automotive/">automotive manufacturers</a> monitor production counts, cycle time, downtime, and quality in real time, making capacity gaps visible before they become launch problems.</p><p><strong>See how FlowFuse works in real environments</strong></p><p>Walk through real use cases and see how teams connect systems, automate workflows, and deploy at scale.</p><p><a href="https://flowfuse.com/book-demo/">Book a Demo</a></p>]]></content>
        <updated>2026-08-21T00:00:00.000Z</updated>
        <link href="https://flowfuse.com/blog/2026/08/run-at-rate/"/>
        
    </entry>
    <entry>
        <id>https://flowfuse.com/blog/2026/08/what-is-scada/</id>
        <title>What Is SCADA? Supervisory Control and Data Acquisition</title>
        <summary>SCADA Architecture: SCADA systems rely on field devices, PLCs and RTUs, and HMIs working together to give operators real-time visibility and control across equipment. System Boundaries Matter: Knowing where SCADA ends and PLCs, HMIs, and MES platforms begin prevents duplicated effort and gaps in coverage across multi-site operations. Extend, Don't Replace: Legacy SCADA systems in brownfield environments can be connected to modern IT/OT tools using platforms like FlowFuse, allowing manufacturers to standardize a workflow once and deploy it across every site without rebuilding from scratch.</summary>
        <content type="html"><![CDATA[<p>A production line goes down and the first alarm appears on a screen minutes before anyone on the floor notices. For teams managing multiple plants, that screen is often the only real-time view into what is happening across PLCs, sensors, and equipment scattered across dozens of sites. Understanding what SCADA is matters more than ever, especially with unplanned downtime costing industrial manufacturers an estimated <a href="https://www.eng.auburn.edu/~szm0001/papers/GC23-technology.pdf" rel="nofollow">$50 billion</a> a year.</p><p>FlowFuse, an industrial application platform, works directly inside the environments where SCADA systems operate, connecting to PLCs, sensors, and edge devices as part of building operational applications across plants and production lines. The platform is SOC 2 Type 1 and Type 2 certified and is trusted by manufacturers including Bosch, Cargill, Moderna, and 25 or more other enterprise customers to standardize workflows across hundreds of sites without rebuilding from scratch.</p><p>This article breaks down what SCADA is, how it works, how it compares to related systems like PLCs and HMIs, and why it still matters in brownfield environments today.</p><a href="https://app.flowfuse.com/account/create"><img src="https://flowfuse.com/blog/2026/08/images/scada-article-cta.png" alt="Extend your SCADA, don't replace it — connect to a PLC over OPC UA or Modbus and build a view on top"/></a><h2 id="how-does-scada-work-the-core-components">How Does SCADA Work? The Core Components</h2><p>SCADA, which stands for Supervisory Control and Data Acquisition, is a system that collects data from equipment across a plant and gives operators a centralized view to monitor and control that equipment in real time. A simple definition covers what the system does, while the SCADA meaning points to its core function beyond just the acronym, supervising and gathering data across distributed equipment. Any basic SCADA system definition includes four layers working together: field devices, controllers, communication networks, and the software that displays and stores the data. Each of these layers works together as follows:</p><p><img alt="SCADA architecture diagram showing sensors and manual inputs feeding data to PLCs or RTUs, which pass it to server infrastructure, connected over a LAN or WAN network to an HMI or SCADA operator view." src="https://flowfuse.com/blog/2026/08/images/scada-basic-diagram.png"/><em>The four layers of a SCADA system: field devices, controllers, communication networks, and the software operators use to monitor and control equipment.</em></p><h3 id="field-devices-and-sensors">Field Devices And Sensors</h3><p>Sensors and field devices sit closest to the physical process, measuring variables like temperature, pressure, flow rate, and machine status. These devices generate the raw data that everything else in the system depends on. Without accurate field-level data, supervisory dashboards and historical trends built on top of a <a href="https://flowfuse.com/use-cases/scada/">SCADA</a> system lose their value almost immediately.</p><h3 id="plcs-and-rtus">PLCs And RTUs</h3><p>Programmable Logic Controllers and Remote Terminal Units take the raw signals from field devices and convert them into structured data. PLCs typically run more complex local control logic and keep equipment operating safely between supervisory updates, while RTUs are more common in geographically spread-out environments, like pipelines or remote wellheads, where they focus more on data acquisition and communication over long distances. Most industrial environments rely on PLCs as the layer directly beneath SCADA, translating physical inputs into a format the rest of the system can use.</p><h3 id="communication-networks">Communication Networks</h3><p>Communication networks carry data between field devices, controllers, and the central SCADA software, using protocols like <a href="https://flowfuse.com/docs/node-red/protocol/modbus/">Modbus</a>, <a href="https://flowfuse.com/blog/2025/07/reading-and-writing-plc-data-using-opc-ua">OPC UA</a>, <a href="https://flowfuse.com/blog/2024/06/how-to-use-mqtt-in-node-red/">MQTT</a>, or <a href="https://flowfuse.com/blog/2025/10/using-ethernet-ip-with-flowfuse/">Ethernet/IP</a> depending on the equipment and environment. This layer determines how reliably and securely data moves across a facility, and it becomes especially important when connecting older equipment to newer IT/OT platforms.</p><h3 id="hmi-and-central-monitoring-software">HMI And Central Monitoring Software</h3><p>The Human-Machine Interface, or HMI, is where operators view live data, alarms, and trends pulled from PLCs and RTUs. Central SCADA software aggregates this information across multiple lines or sites, storing historical data for reporting and analysis. This layer is what turns raw signals into the visibility manufacturers depend on to catch problems early.</p><h2 id="scada-vs-plc-hmi-and-mes-where-it-fits-in-the-stack">SCADA vs. PLC, HMI, And MES: Where It Fits In The Stack</h2><p>Anyone asking what is SCADA usually runs into overlapping terminology almost immediately, since PLCs, HMIs, and MES platforms all touch the same data at different points. Each system serves a distinct purpose, and confusing them leads to gaps in coverage or duplicated effort across sites. Getting the distinctions right matters for anyone responsible for architecture decisions across multiple plants:</p><h3 id="scada-vs-plc">SCADA vs. PLC</h3><p>A PLC executes control logic directly on the equipment it is connected to, reacting to inputs in real time without needing a central system. SCADA, by contrast, supervises multiple PLCs at once, pulling their data into a single view for monitoring and historical analysis, and sending supervisory commands like setpoint changes back down to the equipment. For a full breakdown of how PLCs function on their own, see <a href="https://flowfuse.com/blog/2025/12/what-is-plc/">What Is PLC</a>.</p><h3 id="scada-vs-hmi">SCADA vs. HMI</h3><p>An HMI is the interface operators interact with directly, usually tied to a single machine or line. SCADA software aggregates data from many HMIs and PLCs across a facility or multiple sites, giving a broader operational picture than any single interface can provide. Guidance on setting up interfaces at the equipment level is covered in <a href="https://flowfuse.com/blog/2025/11/building-hmi-for-equipment-control/">Building HMI for Equipment Control</a>.</p><h3 id="scada-vs-mes">SCADA vs. MES</h3><p>MES platforms manage production scheduling, quality records, and traceability at a business process level, while SCADA focuses on real-time equipment data and control. These systems are meant to work together, not replace each other, though many manufacturers still rely on tools like <a href="https://flowfuse.com/vs/kepware/">Kepware</a> to bridge the gap between SCADA data and <a href="https://flowfuse.com/blog/2025/06/what-is-mes/">MES</a> or <a href="https://flowfuse.com/blog/2025/06/connect-shop-floor-to-odoo-erp-flowfuse/">ERP</a> systems. This is a core part of what SCADA is often used for in practice.</p><h2 id="why-scada-still-matters-in-modern-brownfield-environments">Why SCADA Still Matters In Modern Brownfield Environments</h2><p>SCADA systems are not going anywhere in most industrial facilities, and understanding why requires looking at how much infrastructure is built around them. Many plants run SCADA installations that are ten or twenty years old, tied directly to equipment that still works fine and would be expensive or risky to replace. Ripping out a functioning brownfield environment rarely makes sense when the goal is better visibility, not a full overhaul.</p><p>The real challenge is connecting older SCADA systems to newer IT and OT tools without breaking what already works. Protocol choice plays a large role here, and manufacturers evaluating how to move data between legacy equipment and modern platforms often need SCADA explained in the context of specific protocols like OPC UA and MQTT. The comparison in <a href="https://flowfuse.com/blog/2026/01/opcua-vs-mqtt/">OPCUA vs MQTT</a> covers how each protocol handles that kind of connectivity differently.</p><p><img alt="Diagram showing a SCADA chain of field devices, PLCs or RTUs, server infrastructure, and an HMI or SCADA view, with a FlowFuse IT/OT connectivity and application layer exchanging data with the PLC and server tiers and feeding FlowFuse operational applications and MES, ERP, or cloud systems." src="https://flowfuse.com/blog/2026/08/images/scada-flowfuse-extension.png"/><em>Extending a brownfield SCADA system with an IT/OT layer rather than replacing it.</em></p><p>Extending a brownfield SCADA system, rather than replacing it, lets manufacturers keep proven equipment logic in place while adding the <a href="https://flowfuse.com/use-cases/it-ot-middleware/">IT/OT connectivity</a> needed for enterprise-wide visibility. That approach protects existing investment and reduces the operational risk that comes with large-scale system replacement.</p><h2 id="final-thoughts">Final Thoughts</h2><p>SCADA remains one of the most important systems on any plant floor, giving operators and engineers the visibility needed to catch issues before they turn into costly downtime. Knowing how the pieces fit together, from field devices up through PLCs, HMIs, and central monitoring software, makes it easier to spot where gaps exist and where legacy equipment can be extended rather than replaced.</p><p>For manufacturers managing SCADA across multiple sites, the harder problem is often not the system itself but everything built around it: custom scripts, one-off integrations, and workflows that get rebuilt at every new plant. An industrial application platform like FlowFuse addresses that layer directly, letting teams take a proven operational workflow and deploy it across every site instead of starting over each time. Build once, run everywhere is not just a convenience. It is what breaks the rebuild cycle for good.</p><p><strong>See how FlowFuse works in real environments</strong></p><p>Walk through real use cases and see how teams connect systems, automate workflows, and deploy at scale.</p><p><a href="https://flowfuse.com/book-demo/">Book a Demo</a></p>]]></content>
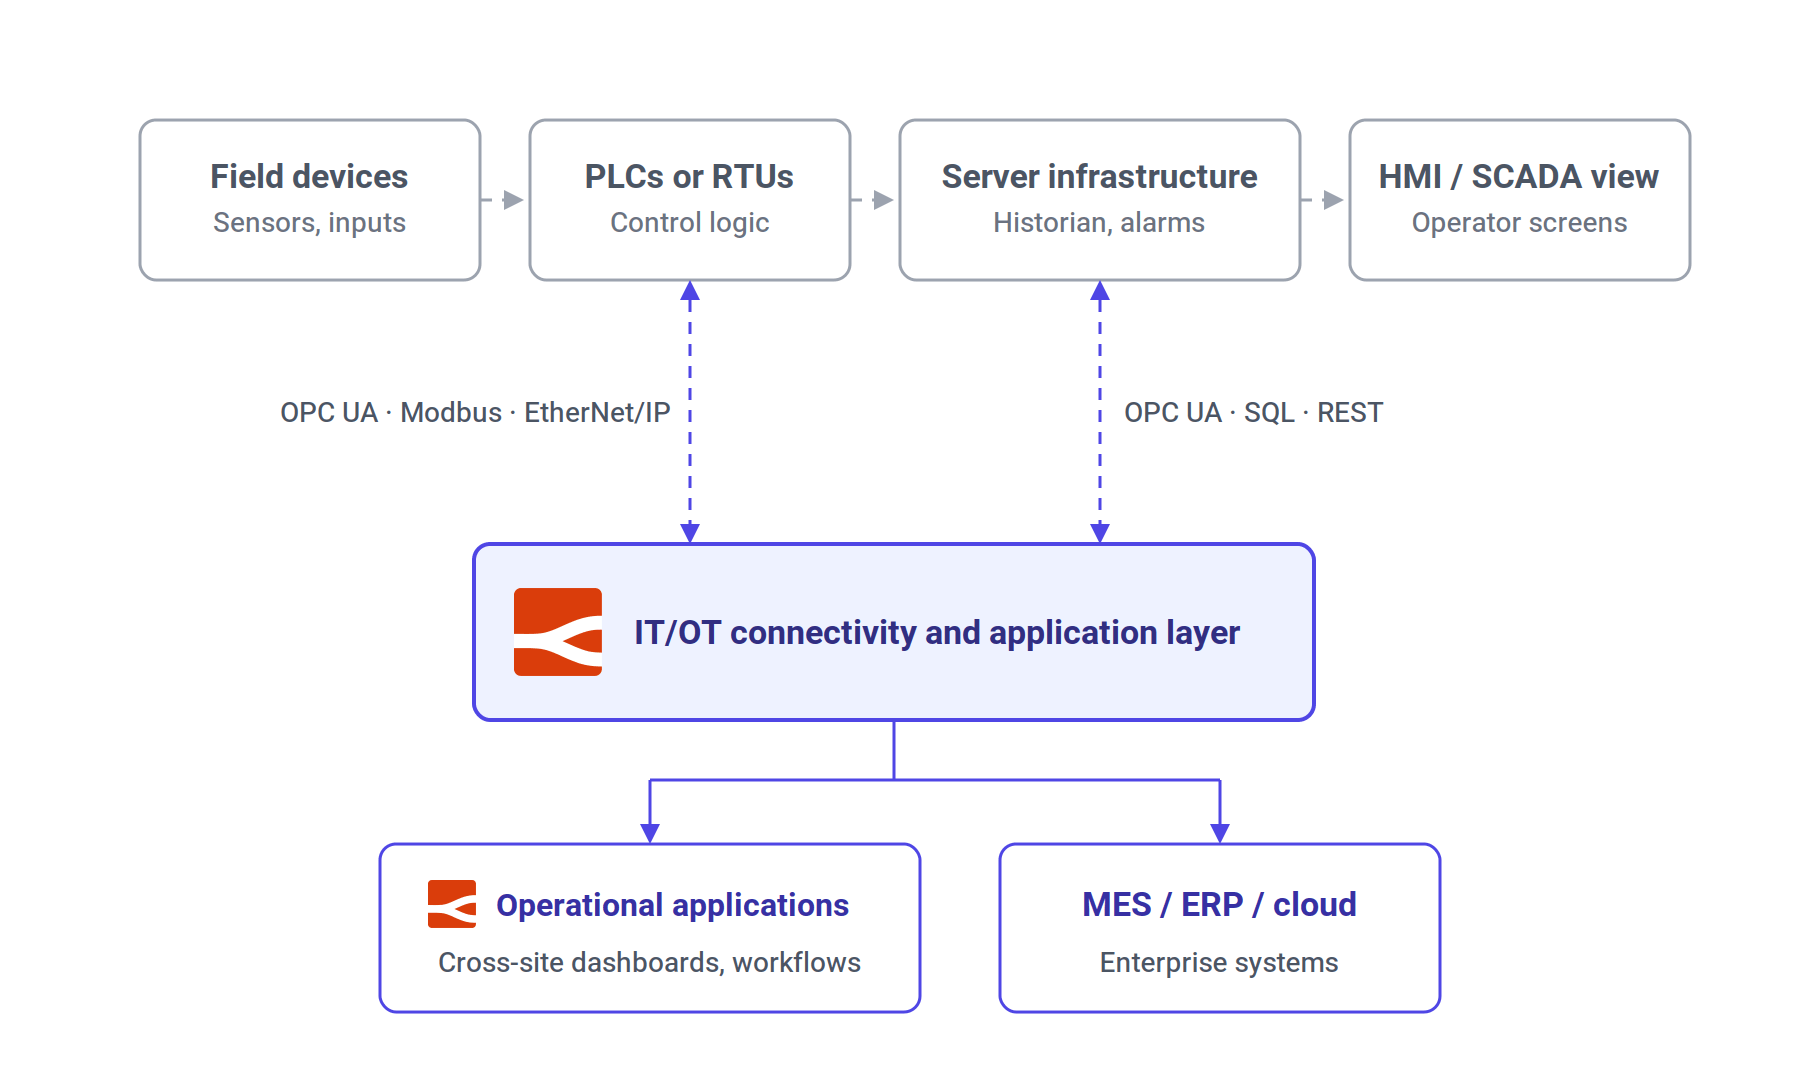

        <updated>2026-08-20T00:00:00.000Z</updated>
        <link href="https://flowfuse.com/blog/2026/08/what-is-scada/"/>
        
    </entry>
    <entry>
        <id>https://flowfuse.com/blog/2026/08/automotive-traceability/</id>
        <title>Automotive Traceability: How Production Data Gets Tied to a Part</title>
        <summary>Identity Is the Foundation: Traceability starts with a unique identifier for each part, which turns isolated machine readings into an as-built record that can be searched later. Connection Beats Collection: Most factories already generate the data traceability needs. The hard part is associating a PLC reading, a scanner event, and an inspection result with the same part at the same moment. Extend, Don't Replace: An integration layer like FlowFuse connects existing PLCs, MES platforms, and databases into traceability workflows, so manufacturers build genealogy around the systems already running their lines.</summary>
        <content type="html"><![CDATA[<p>A finished vehicle carries more than its physical components. It carries a production history: the materials used, processes performed, machines involved, and quality checks completed along the way.</p><p>Automotive traceability makes that history possible to reconstruct.</p><h2 id="what-is-automotive-traceability">What Is Automotive Traceability?</h2><p>Automotive traceability is the ability to follow a vehicle, component, or individual part through manufacturing and connect it with the data that production generates along the way. At vehicle level the anchor identifier is the VIN. At component level it is a serial number that serialization applies at the start of the process, and the finished result is often called the as-built record: everything known about how that specific unit came together.</p><p>Take a manufacturer producing brake assemblies. Each assembly receives a unique identifier, and as it moves through production the manufacturer ties that identifier to the supplier who provided the components, the line that assembled the part, the machine that performed each operation, the torque values the tool recorded, the inspection results, the operator, the timestamp of each operation, the batch number, and whether the part passed its quality check.</p><p>Now suppose a quality issue surfaces several days later. Instead of searching through disconnected machine logs, spreadsheets, and production records, the manufacturer looks up the affected part and reads its production history. That is the real value of traceability: it turns production data into a history someone can follow.</p><h2 id="why-traceability-matters-in-automotive-manufacturing">Why Traceability Matters in Automotive Manufacturing</h2><p>Traceability matters more in <a href="https://flowfuse.com/industries/automotive/">automotive manufacturing</a> than in most industries because a problem with one component can affect a large number of vehicles, and because the supply chain runs deep. An OEM depends on Tier 1 suppliers who depend on Tier 2 suppliers, and a defect can enter at any level. <a href="https://flowfuse.com/blog/2026/09/ppap/">PPAP</a> approval confirms each supplier's process before volume production, but traceability is what connects every part built afterward back to that process. It is also expected rather than optional, since IATF 16949 requires manufacturers to define traceability so they can identify and contain suspect product.</p><p>The scale explains the pressure. NHTSA <a href="https://www.nhtsa.gov/sites/nhtsa.gov/files/2025-01/recall-completion-rates-report-update-01172025.pdf" rel="nofollow">processes over 1,000 new recalls each year</a>, and <a href="https://www.nhtsa.gov/document/report-congress-vehicle-safety-recall-completion-rates-report" rel="nofollow">completion rates for most component categories land between 60% and 75%</a>. A recall that covers more vehicles than it needs to therefore costs more and still leaves defective units on the road. Narrowing the scope is not only cheaper, it is more effective.</p><p>Consider a supplier discovering that a batch of components does not meet specification. The manufacturer needs to determine which parts from that batch entered production and which vehicles contain them. That is forward traceability: start with a suspect input and find everywhere it went. Backward traceability works the other way, starting from a returned vehicle and reconstructing what went into it. Without reliable records, either direction turns into a manual investigation across production logs, databases, and spreadsheets. With them, the manufacturer queries the relevant identifiers and gets the affected scope directly.</p><p>The same connected history speeds up root-cause analysis. When a component fails final test, a quality engineer starts at its identifier and works backward. Which material batch went into it? Which machine and station handled it? What were the process parameters, and did other parts from the same window show similar results? That makes traceability an engineering tool rather than a compliance checkbox.</p><p>It also works proactively. If failures start increasing on one assembly line, engineers compare failed parts against machine parameters, tooling changes, and operating conditions. When a process parameter drifts outside its normal range, teams catch the trend before it produces a large batch of defective parts.</p><a href="https://flowfuse.com/book-demo/"><img src="https://flowfuse.com/images/cta/book-a-demo.png" alt="Walk through your FlowFuse setup with our team - book a demo"/></a><h2 id="where-traceability-starts-incoming-material">Where Traceability Starts: Incoming Material</h2><p>Most traceability projects begin at the first production station, which is one station too late. The chain has to start at receiving, because that is where the plant takes custody of material whose history it did not record.</p><p>When a shipment arrives, the plant captures the supplier, the supplier's lot or batch number, the material certificate where one applies, the quantity, and the date. That record becomes the top of the genealogy chain, and every part built from that material inherits the link. Skip it, and forward traceability stops at the plant boundary: you can prove which vehicles used lot <code>B-184</code>, but not who supplied <code>B-184</code> or what else arrived alongside it.</p><p>This is the line between internal and external traceability. Internal covers everything inside the plant, from receiving through production and shipping. External extends the chain across organizational boundaries, so a Tier 1 supplier can answer questions about material that came from a Tier 2 supplier. Recall investigations almost always need both, which is why label and identification standards matter: a code applied at a Tier 2 plant has to stay readable at the Tier 1 plant and again at the OEM.</p><p>Incoming material also brings the batch-versus-unit question forward. A supplier may ship serialized components, or a lot of bulk material with one identifier covering thousands of pieces. Whatever granularity arrives at the dock sets the floor for how precisely the plant can trace anything built from it.</p><h2 id="what-data-needs-to-be-tracked">What Data Needs to Be Tracked?</h2><p>A traceability system is only as useful as the data connected to each part. Requirements vary, but a few categories show up almost everywhere.</p><p>Part identity is the starting point: a <a href="https://flowfuse.com/blog/2025/11/building-label-scanner-with-flowfuse/">serial number, Data Matrix code, or RFID tag</a> that links a physical component to its digital record. Automotive commonly uses direct part marking, where a laser or dot-peen head cuts the code into the component itself so it survives washing, painting, and handling. Production information describes where and when the plant processed the part, covering line, workstation, machine, operator, and timestamp. Process data adds detail about the operation itself, which might mean torque, pressure, temperature, or cycle time. <a href="https://flowfuse.com/blog/2026/08/statistical-process-control/">Quality data</a> records whether the part passed its inspections and tests. Material and batch information connects the finished component back to its source, which matters most when a supplier batch later turns out to have a problem.</p><p>Not every part warrants a serial number. Safety-critical and high-value components such as airbags, brake assemblies, and battery packs usually get unit-level identity, while fasteners, adhesives, and bulk materials stay at batch or lot level. Choosing the wrong granularity costs money in both directions: serializing everything adds marking and scanning time at every station, while batch-tracking a safety-critical part widens the containment scope when something goes wrong.</p><p>None of these datasets should sit in isolation. The goal is to establish relationships between them, so a vehicle connects to an assembly, which connects to a component, a production step, a machine, its process data, and the resulting quality result.</p><h2 id="why-connecting-the-factory-is-the-hard-part">Why Connecting the Factory Is the Hard Part</h2><p>The information traceability requires comes from systems that nobody designed to work together. A PLC holds machine states and process values. A scanner identifies the part. A vision system produces an inspection result. An MES manages production information while a database holds historical records. Each works fine on its own.</p><p>A tightening controller may report that an operation finished at 10:42:13 with a torque value of 42 Nm. A scanner may have identified the part as <code>BRK-10482</code> moments earlier. The traceability system has to establish that those two events belong together, which means treating machine connectivity, timestamps, identifiers, and storage as one workflow rather than five separate projects.</p><p>The problem compounds because one line often includes equipment from several vendors, each exposing information differently. One machine speaks <a href="https://flowfuse.com/blog/2025/07/reading-and-writing-plc-data-using-opc-ua">OPC UA</a>, another communicates over <a href="https://flowfuse.com/blog/2025/10/using-ethernet-ip-with-flowfuse/">EtherNet/IP</a>, and other equipment publishes through <a href="https://flowfuse.com/blog/2024/06/how-to-use-mqtt-in-node-red/">MQTT</a> or exposes a vendor interface of its own.</p><p>None of this requires replacing the existing <a href="https://flowfuse.com/blog/2025/06/what-is-mes/">MES</a>, <a href="https://flowfuse.com/use-cases/scada/">SCADA</a>, <a href="https://flowfuse.com/landing/plc/">PLCs</a>, or vendor systems. FlowFuse acts as a low-code <a href="https://flowfuse.com/use-cases/it-ot-middleware/">IT/OT integration layer</a> between them, connecting machines, protocols, databases, and MES platforms without a rip-and-replace project. Rather than pushing every piece of machine data into a central system, workflows process and route information when relevant production events occur.</p><h2 id="associating-production-data-with-individual-parts">Associating Production Data With Individual Parts</h2><p>Collecting machine data is only half the problem. The system also needs to know which part that data belongs to, and a unique identifier provides the answer.</p><p>Take a simple assembly station. A scanner reads <code>PART-84721</code>, and the station opens an active context for that part. The identifier also selects the tightening program, so the tool runs the limits that belong to this specific assembly and stays locked until a valid scan arrives. When the operation finishes, the stored record shows part <code>PART-84721</code> at station <code>Assembly-04</code>, tightened under program 7, with a torque of 42.1 Nm, an angle of 87.4°, an <code>OK</code> result, and a timestamp of 10:42:13.</p><p><img alt="Diagram showing a scanner sending part ID PART-84721 to a station PLC, which selects the program and enables a tightening controller over fieldbus and receives an OK or NOK status. FlowFuse reads the part ID from the PLC over OPC UA and exchanges the identifier and results with the tightening controller over Open Protocol, then writes one record to data storage, which an operational application uses for genealogy lookup and containment." src="https://flowfuse.com/blog/2026/08/images/station-data-flow.png"/><em>A scan opens the context; the tightening result lands against the part that was scanned.</em></p><p>Notice that the values arrive from two different systems. The identifier lives in the station controller, the torque and the verdict live in the tightening controller, and neither one means much without the other. That record is far more useful than an isolated 42.1 Nm reading, because the identifier supplies the context. A FlowFuse workflow handles the logic directly: take the identifier, collect the values from the relevant equipment, transform them into the required structure, and route the record to its destination.</p><p>The same identity check also enables error-proofing. If a part reaches station 5 without a passing record from station 4, the workflow blocks the operation instead of adding another entry to a history nobody reads until a recall. Traceability that only records is a reporting system. Traceability that interlocks stations stops defects from moving down the line.</p><h2 id="building-part-genealogy">Building Part Genealogy</h2><p>Once manufacturers connect production records, they can build part genealogy, which describes the relationships between a finished product and everything that contributed to it.</p><p>Vehicle A contains battery pack 1042, which contains module M-07, built from cell lot <code>B-184</code> supplied by cell supplier X. Line 3 and station 7 are not links in that chain. They belong to the point where one item was consumed into another, recorded alongside the timestamp, operator, and result.</p><p><img alt="Vertical chain showing part genealogy: a vehicle identified by VIN contains battery pack serial 1042, which contains battery module M-07, which contains cells from lot B-184 supplied by an external cell supplier. Arrows show the chain can be read upward to find what went into a unit or downward to find where a lot was used." src="https://flowfuse.com/blog/2026/08/images/part-genealogy.png"/><em>Genealogy links a finished vehicle to the components and suppliers behind it, and reads in both directions.</em></p><p>The chain reads both ways. Trace back from a returned vehicle to find every component behind it, or forward from a defective cell lot to find which modules used it, which packs took those modules, and which vehicles received those packs. The same principle applies down to individual fastening operations, welds, and inspection points.</p><p>Notice also where the identifiers change type. The vehicle carries a VIN and the pack and module carry serial numbers, so each one is traceable as a single unit. The cells carry a lot number, so they are traceable as a batch. Where serialization stops is where containment scope widens.</p><h2 id="structuring-and-storing-traceability-data">Structuring and Storing Traceability Data</h2><p>Genealogy only works if the <a href="https://flowfuse.com/blog/2025/06/structuring-storing-data-mes-integration/">underlying data has structure</a>. A traceability database typically holds parts and serial numbers, production orders, workstations, machines, process steps, materials and batches, measurements, quality results, and timestamps, and the relationships between those records matter as much as the values themselves. A production event that references a part ID, station ID, process ID, and timestamp lets someone reconstruct the history later without duplicating information across systems.</p><p>FlowFuse transforms and routes production data into the platform a manufacturer already runs, so teams structure information to fit their existing architecture instead of forcing every production system into one storage technology.</p><p>High-volume environments usually separate real-time operational data from long-term historical data. Real-time data supports production monitoring and immediate decisions, while historical data stays available for quality analysis, audits, and investigations. Retention is worth settling early, because customer contracts and regulatory requirements often set it rather than leaving it to the plant.</p><h2 id="scaling-traceability-across-production-lines">Scaling Traceability Across Production Lines</h2><p>A solution that works at one station becomes hard to manage once it spreads across an entire factory. Different lines carry different equipment, protocols, and processes, while manufacturers still want one consistent approach to collecting production information.</p><p>Instead of running a separate integration project for every line, manufacturers can <a href="https://flowfuse.com/landing/building-and-scaling-industrial-applications/">establish reusable workflows and deployment patterns</a>. FlowFuse provides centralized management for industrial applications across production environments, which helps teams move past one-off integrations as applications reach multiple lines or plants. Workflows still adapt to the equipment at each site while following common patterns for deployment, management, and governance.</p><h2 id="final-thoughts">Final Thoughts</h2><p>Automotive traceability is about more than knowing where a part came from. It makes production observable enough that manufacturers understand what happened, when it happened, and how the events connect.</p><p>That takes more than collecting data. Manufacturers need to connect machines and assets, move information between protocols and systems, structure the result, and deliver it to the people and applications that depend on it. An event-driven integration layer like FlowFuse supplies that connective tissue without replacing the systems already running the factory.</p><p>The payoff is an architecture that grows with the operation, from one station to a full line and eventually across multiple plants. When every relevant production event connects to the part it belongs to, manufacturers gain a complete, searchable history of how their products were made. The next time a quality issue appears, they are no longer asking what happened. They can start answering it.</p><p><strong>Build Traceability On the Systems You Already Run</strong></p><p>Connect PLCs, scanners, inspection systems, and databases into production workflows you can deploy across every line with FlowFuse.</p><p><a href="https://flowfuse.com/contact-us/">Contact Us</a></p>]]></content>
        <updated>2026-08-19T00:00:00.000Z</updated>
        <link href="https://flowfuse.com/blog/2026/08/automotive-traceability/"/>
        
    </entry>
    <entry>
        <id>https://flowfuse.com/blog/2026/08/layered-process-audit/</id>
        <title>What Is a Layered Process Audit (LPA)?</title>
        <summary>A layered process audit (LPA) is a structured way to verify critical manufacturing process controls through regular checks by different levels of management.</summary>
        <content type="html"><![CDATA[<p>Manufacturing problems are often found after production rather than where they start. A machine setting may be wrong, a process step may be skipped, or a critical control may no longer be followed.</p><p>A <strong>Layered Process Audit (LPA)</strong> helps manufacturers catch these problems earlier by regularly checking critical process controls while production is running.</p><p>This guide explains what an LPA is, how the layers work, and how manufacturers use them on the shop floor. As LPA programs grow, digitizing audits can make it easier to capture findings, track corrective actions, and connect audit results with production data.</p><a href="https://app.flowfuse.com/account/create"><img src="https://flowfuse.com/blog/2026/08/images/lpa-cta-1.png" alt="Turn Shop-Floor Audits Into Actionable Data"/></a><h2 id="what-is-a-layered-process-audit">What Is a Layered Process Audit?</h2><p>A <strong>Layered Process Audit (LPA)</strong> is a structured, process-focused audit in which personnel at different levels of an organization systematically verify that critical manufacturing processes, controls, and work practices conform to defined requirements and standards.</p><p>Instead of inspecting finished parts, an LPA checks the process itself. An auditor observes the operation and verifies selected controls such as machine settings, standard work, tooling, materials, or error-proofing.</p><p>The <strong>layers</strong> are different levels of management. A supervisor may check a process daily, an area manager weekly, and plant leadership monthly.</p><p>The layers are not different stages of production. They are different levels of oversight.</p><p>LPAs are widely used in <a href="https://flowfuse.com/industries/automotive/">automotive manufacturing</a> and other industries where consistent process control is important. They complement formal process and product audits rather than replacing them.</p><h2 id="how-do-lpa-layers-work">How Do LPA Layers Work?</h2><p>Each layer checks important process controls at a different frequency.</p><table><thead><tr><th>Layer</th><th>Typical role</th><th>Typical frequency</th></tr></thead><tbody><tr><td>Layer 1</td><td>Supervisor / Team leader</td><td>Daily</td></tr><tr><td>Layer 2</td><td>Area manager</td><td>Weekly</td></tr><tr><td>Layer 3</td><td>Plant manager / Director</td><td>Monthly</td></tr></tbody></table><p>These frequencies are common starting points, not universal requirements. Manufacturers can adjust them based on process risk.</p><p><img alt="Three layered process audit levels: Layer 1 Supervisor daily, Layer 2 Area Manager weekly, and Layer 3 Plant Leadership monthly, all checking the same critical controls at the same station." data-zoomable="" src="https://flowfuse.com/blog/2026/08/images/layered-process-audit-level.png"/></p><p>Layer 1 is closest to the operation and focuses on whether the process is being followed as defined.</p><p>Layer 2 provides broader oversight across production areas and can identify recurring findings or problems that were not resolved.</p><p>Layer 3 looks across the plant to identify patterns and verify that important issues are being addressed.</p><p>The same critical controls can therefore be checked regularly by people with different levels of responsibility.</p><h2 id="layered-process-audit-example">Layered Process Audit Example</h2><p>Consider an automotive assembly station where a component must be tightened to a defined torque.</p><ol><li><strong>Select the process.</strong> Start with a high-risk operation such as one with customer complaints, scrap, rework, safety exposure, or critical process parameters. A <a href="https://flowfuse.com/blog/2025/08/pareto-chart-manufacturing-guide/">Pareto chart</a> is a useful way to identify the stations causing the largest share of defects.</li><li><strong>Create the checklist.</strong> Use the <a href="https://www.aiag.org/quality/automotive-core-tools/fmea" rel="nofollow">PFMEA</a>, control plan, work instructions, and recent quality issues. Ten to fifteen objective questions is usually enough.</li><li><strong>Define the schedule.</strong> Decide which layer audits each area and how often.</li><li><strong>Train the auditors.</strong> Auditors should observe the process, ask factual questions, and record evidence rather than opinions.</li><li><strong>Perform the audit at the station.</strong> Watch the operation and record answers while standing at the workstation.</li><li><strong>Correct immediate issues.</strong> Fix simple problems during the audit whenever possible.</li><li><strong>Assign <a href="https://flowfuse.com/blog/2026/09/capa-corrective-preventive-action/">corrective actions</a>.</strong> Give each finding an owner and a due date.</li><li><strong>Verify closure.</strong> Confirm that the action was completed and remains effective during the next audit cycle.</li></ol><p>The supervisor corrects the setting and records the finding. During a later Layer 2 audit, the area manager checks the same control and confirms that the tool is still being used within the required range.</p><p>If similar findings appear on other stations, plant leadership can identify a wider problem with tool settings or process control.</p><p>This illustrates the purpose of an LPA: <strong>find process deviations close to where they happen and use different management layers to keep critical controls in place.</strong></p><h2 id="how-to-run-a-layered-process-audit">How to Run a Layered Process Audit</h2><p>An LPA can be straightforward when it focuses on the controls that matter most.</p><h3 id="identify-the-process">Identify the Process</h3><p>Start with a process where regular verification is valuable, such as one with recurring defects, high scrap or rework, customer complaints, or critical process parameters. A <a href="https://flowfuse.com/blog/2025/08/pareto-chart-manufacturing-guide/">Pareto chart</a> can help identify where problems are concentrated.</p><h3 id="define-what-to-verify">Define What to Verify</h3><p>Use information from the PFMEA, <a href="https://flowfuse.com/blog/2026/08/control-plans">control plan</a>, <a href="https://flowfuse.com/blog/2026/07/digital-work-instruction/">work instructions</a>, and previous quality problems to identify the critical controls. Our <a href="https://flowfuse.com/blog/2026/09/layered-process-audit-checklist-template/">LPA checklist template</a> has example questions to help you get started.</p><h3 id="assign-the-layers">Assign the Layers</h3><p>Decide which management level will perform the audit and how often. Higher-risk processes may need more frequent checks.</p><h3 id="perform-the-audit-at-the-workstation">Perform the Audit at the Workstation</h3><p>The auditor observes the actual operation and records whether the defined requirements are being followed.</p><h3 id="correct-and-follow-up">Correct and Follow Up</h3><p>Simple problems can be corrected immediately. Other findings should have an owner and due date, with a later audit confirming that the issue has been resolved.</p><p>An LPA should be short enough to fit into normal shop-floor activity. If it becomes a lengthy inspection, its scope is probably too broad.</p><h2 id="common-lpa-problems">Common LPA Problems</h2><p>An LPA program can lose its value when the audit becomes a paperwork exercise.</p><p>Pencil-whipping is one common problem: an audit is marked complete without the auditor actually checking the process.</p><p>Another is repeat findings. If the same problem appears in every audit but nothing changes, the organization is recording the problem without solving it.</p><p>Missed management layers can also weaken the program. If higher-level managers stop performing their audits, the additional oversight disappears.</p><p>Finally, the audit criteria can become outdated when the process changes. LPA questions should be reviewed periodically to make sure they still focus on current process risks.</p><h2 id="lpa-vs-process-audit">LPA vs. Process Audit</h2><p>An LPA and a process audit both examine manufacturing processes, but they are used differently.</p><table><thead><tr><th></th><th>Layered Process Audit</th><th>Process Audit</th></tr></thead><tbody><tr><td>Frequency</td><td>Frequent</td><td>Usually less frequent</td></tr><tr><td>Scope</td><td>Selected critical controls</td><td>Broader process</td></tr><tr><td>Auditors</td><td>Multiple management levels</td><td>Typically trained auditors</td></tr><tr><td>Purpose</td><td>Routine process verification</td><td>Detailed process evaluation</td></tr></tbody></table><p>An LPA provides frequent checks of important controls, while a process audit provides a deeper assessment of the overall process.</p><h2 id="digitizing-layered-process-audits">Digitizing Layered Process Audits</h2><p>Manufacturers can start an LPA program with paper forms or spreadsheets, but managing audits and findings becomes harder as the program grows.</p><p>A digital LPA can help schedule audits, record findings, notify responsible people, and track actions through closure.</p><p>Connecting the audit with production data provides another benefit. With FlowFuse, manufacturers can connect an LPA application to machines, <a href="https://flowfuse.com/landing/plc/">PLCs</a>, sensors, <a href="https://flowfuse.com/docs/node-red/database/">databases</a>, and other industrial systems.</p><p>This allows audit results to be viewed alongside production information such as downtime, machine states, or process parameters. Instead of only recording that a process failed, teams can investigate what was happening around the failure.</p><p>With <a href="https://flowfuse.com/platform/dashboard">FlowFuse Dashboard</a>, manufacturers can build applications to record audit results, track findings, and visualize them alongside operational data.</p><p><strong>Digitize your shop-floor audits</strong></p><p>Talk to us about building LPA forms, alerts, and corrective action tracking on your existing industrial data infrastructure.</p><p><a href="https://flowfuse.com/contact-us/">Contact Us</a></p>]]></content>
        <updated>2026-08-14T00:00:00.000Z</updated>
        <link href="https://flowfuse.com/blog/2026/08/layered-process-audit/"/>
        
    </entry>
</feed>